The price of $XRP has been stuck in a tricky situation lately. While the long-term trend remains bearish, some short-term relief has appeared over the last few days. Let’s break down what’s happening with $XRP right now.
$XRP Still in a Pullback Phase
Currently, $XRP is holding onto a support area between $2.10 and $2.15. This zone has attracted strong buying pressure, offering temporary stability after a series of bearish moves. However, unless the price manages to push past certain resistance levels, the risks for $XRP remain on the downside.
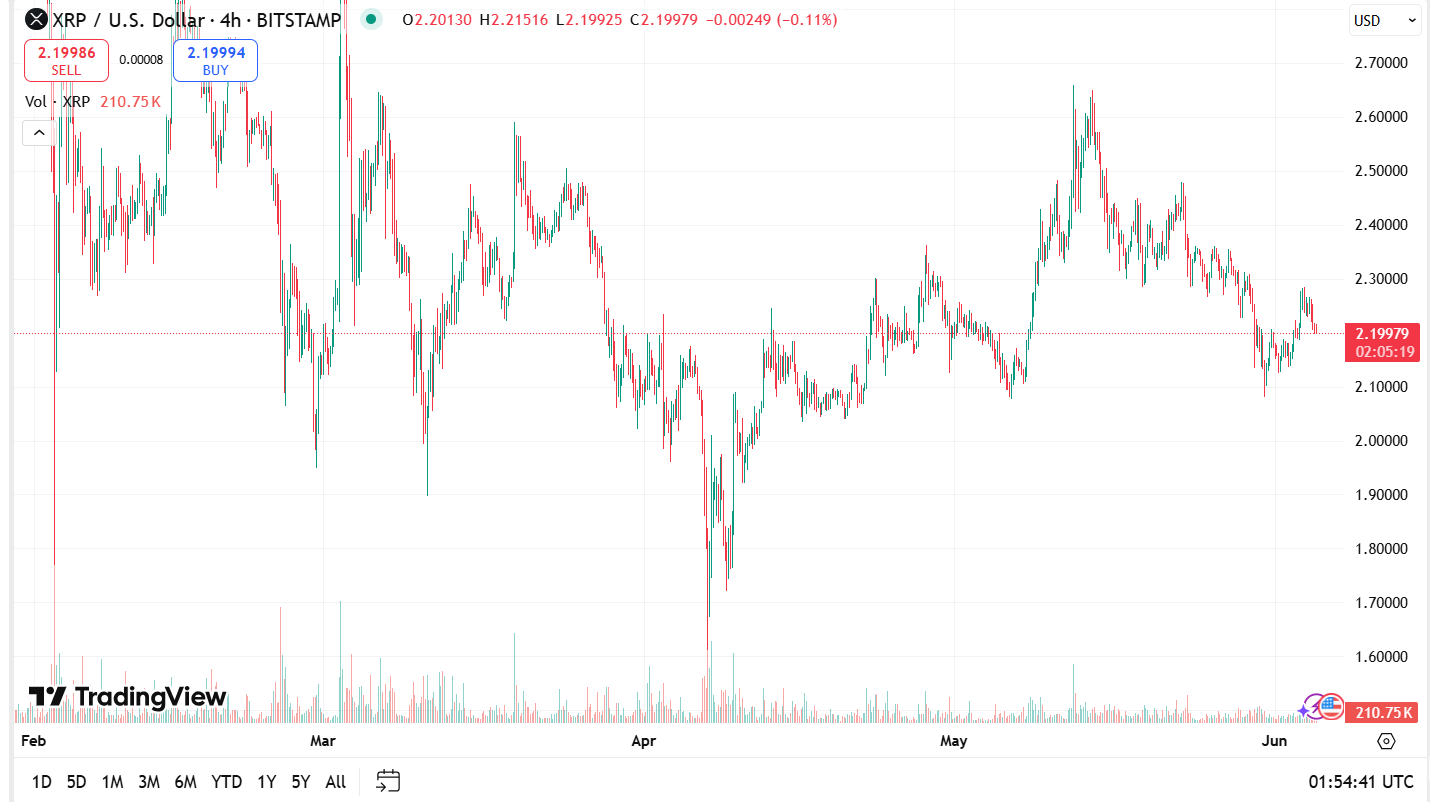
The immediate resistance stands between $2.30 and $2.34. If $XRP can break through this level, the next hurdles are placed at $2.44 and then between $2.56 and $2.62. These are crucial areas to watch because a breakout above them could change the entire direction of $XRP’s price trend.
Is a Bearish Pattern Forming?
If $XRP gets rejected at the resistance between $2.30 to $2.34, it risks forming a head and shoulders pattern on the daily chart. This is a bearish sign and could drag $XRP’s price well below $2.
To avoid this, $XRP needs to close candles above $2.34, and ideally above $2.44. If that happens, it might even hint at a bigger bullish pattern called an inverse head and shoulders, which could lead to higher prices.
That said, there’s an important safety net for $XRP bulls. As long as the price holds above the support zone between $1.21 and $1.55, the long-term bullish case remains intact. A fall below this area, however, would mean that a bigger correction is still unfolding.
What’s the Bigger Picture?
On a longer time frame, analysts are tracking $XRP’s movement using Elliott Wave Theory. According to this, $XRP might currently be in a fifth wave to the upside, aiming for much higher targets like $5.65 — but only if the market gains bullish momentum and breaks into new all-time highs.