Solana price dynamics (Source: TradingView)
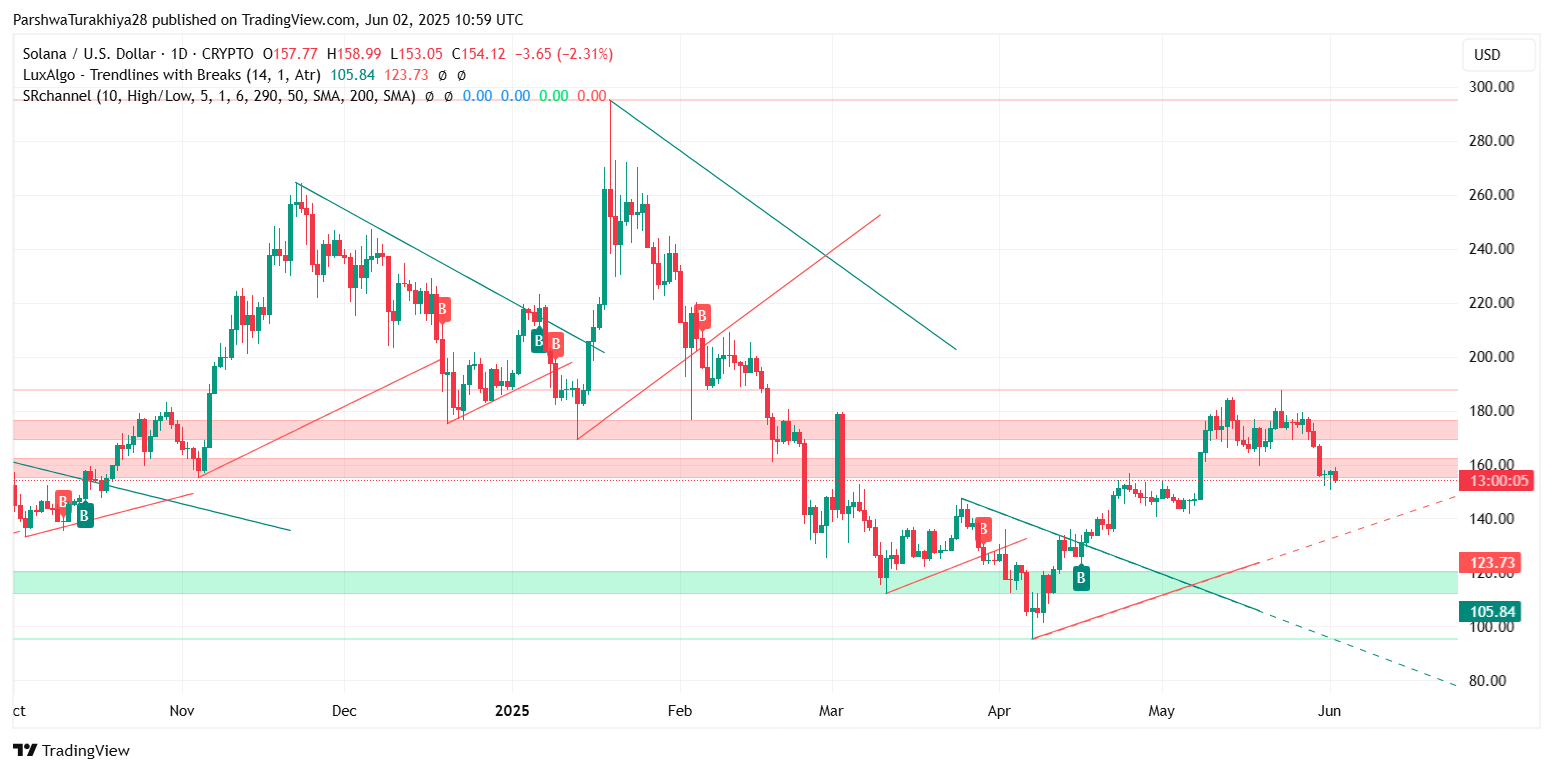
On the daily chart, $SOL continues to respect a broader descending resistance line that has guided price lower since April highs near $188. Price remains structurally bearish below this trendline and the EMA cluster that sits around $160–$164. Until this zone is reclaimed, upward momentum is unlikely to sustain.
Momentum Indicators Point to Further Weakness
Solana price dynamics (Source: TradingView)
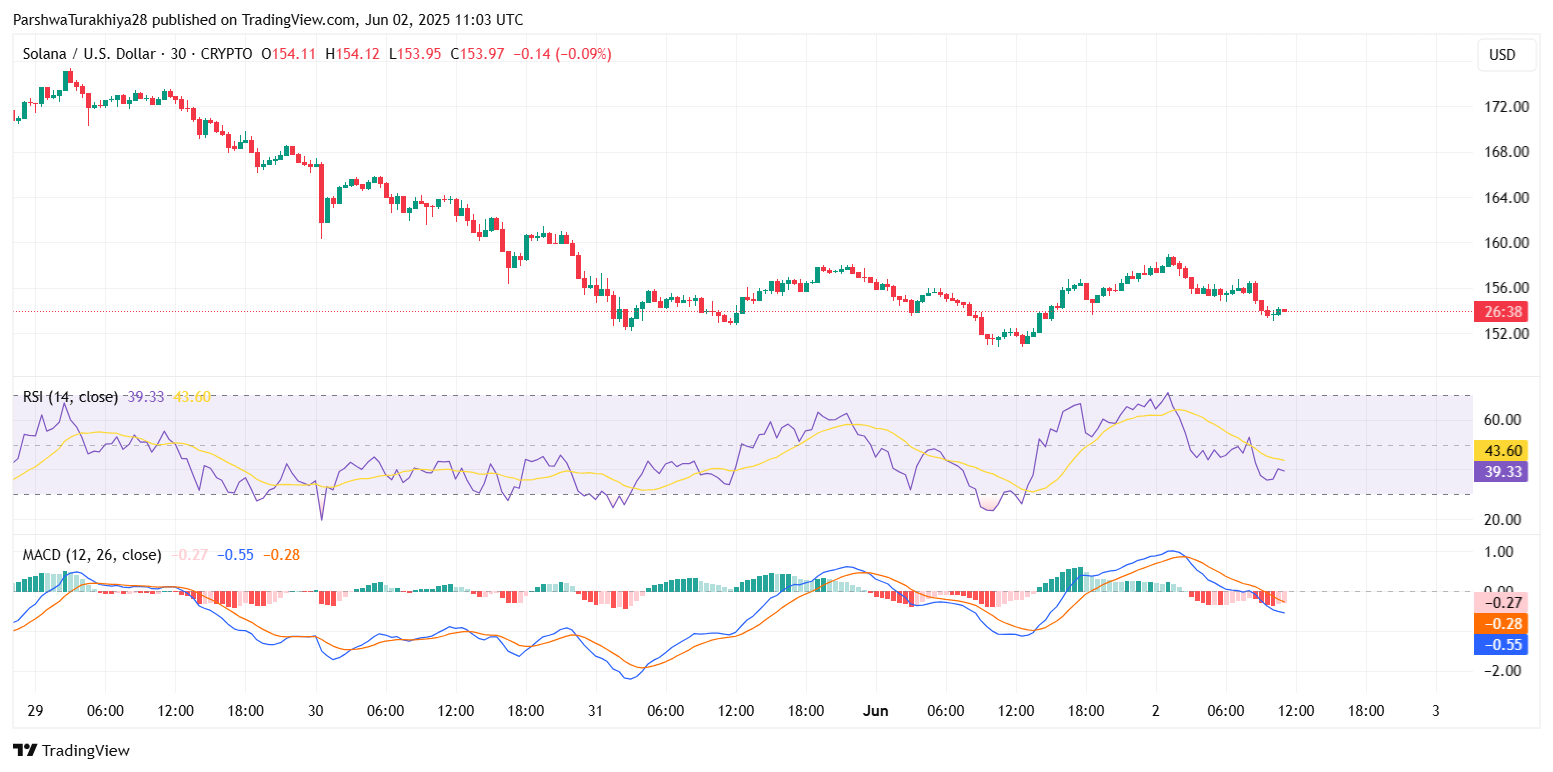
Momentum signals on the lower timeframes reflect clear bearish pressure. The RSI on the 30-minute chart currently sits near 39.3, just above oversold territory, while the 4-hour RSI remains weak around 43, both suggesting buyers are losing control.
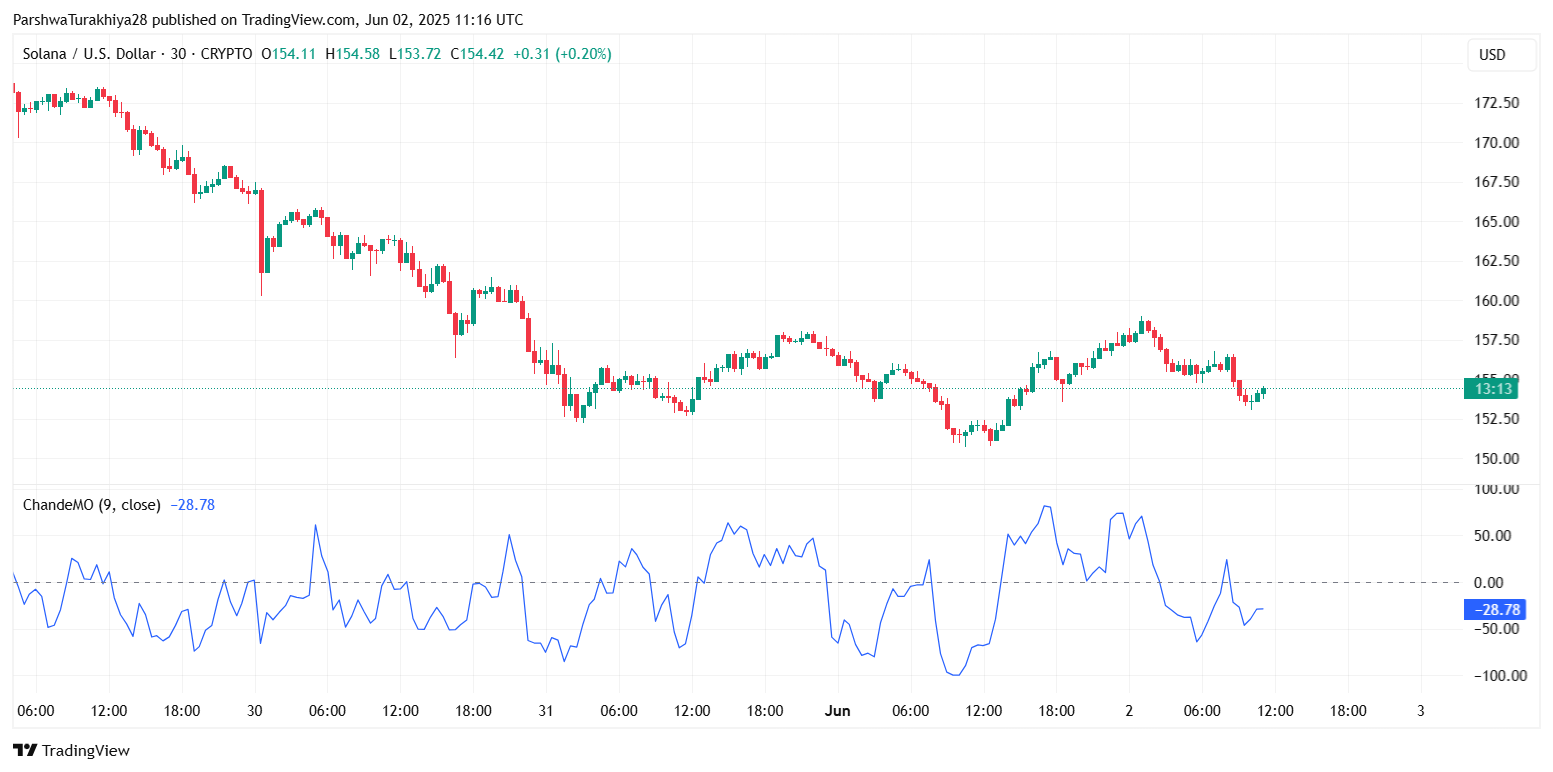
MACD readings on both intraday and 4-hour timeframes show a negative crossover, with the histogram printing red bars, confirming the bearish shift. In addition, the Chande Momentum Oscillator reads around -28.78, further reinforcing the downward bias.
Solana price dynamics (Source: TradingView)
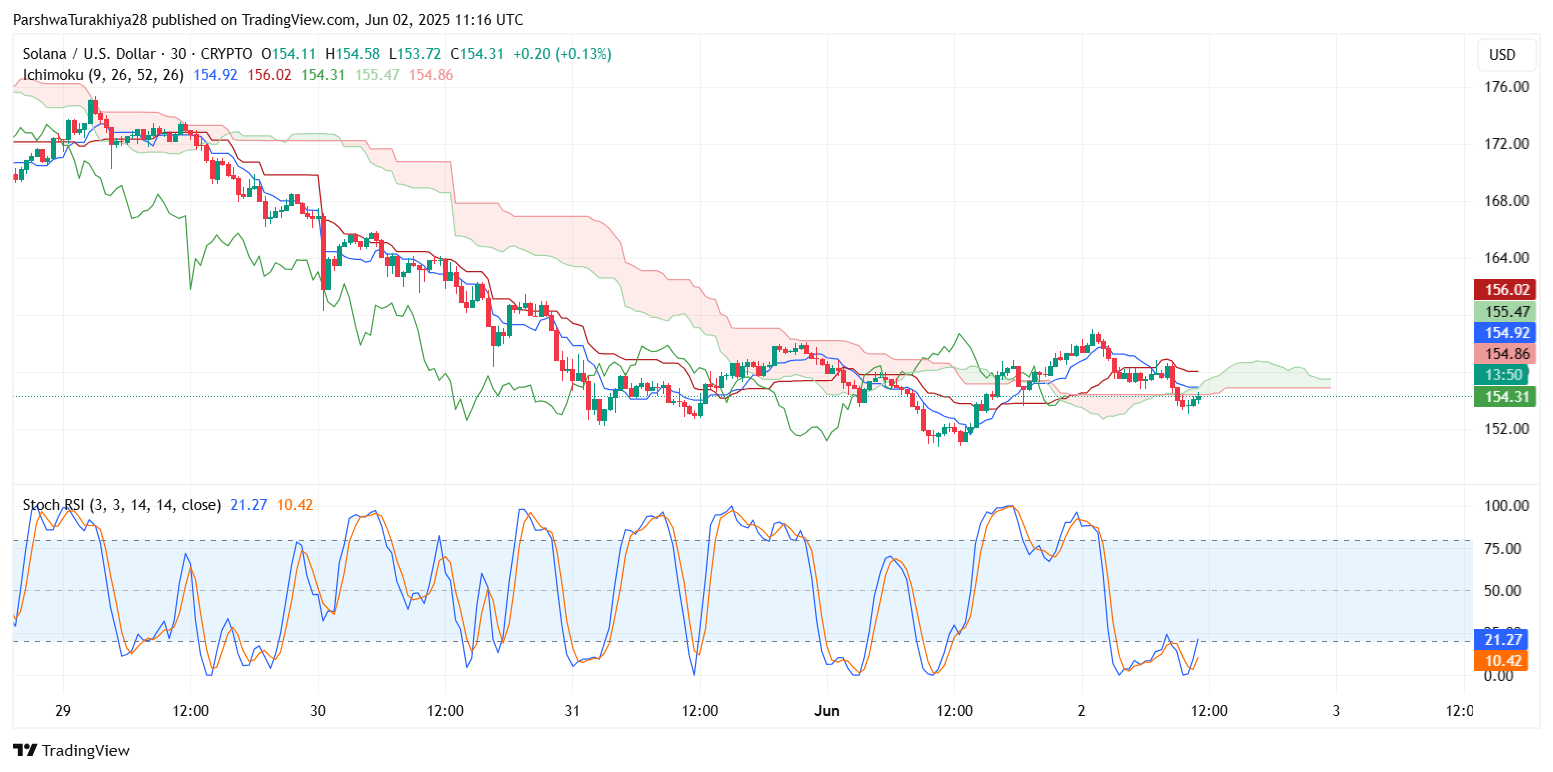
The Stochastic RSI on the 30-minute chart is curling up from oversold levels but lacks confirmation of a bullish crossover. This hesitation, combined with the downward trajectory of broader indicators, reflects continued uncertainty and exhaustion among bulls.
Ichimoku Cloud and Bollinger Bands Signal Compression Risk
Solana price dynamics (Source: TradingView)
On the 30-minute timeframe, Solana is trading at the edge of the Ichimoku Cloud. The flat Tenkan-sen and Kijun-sen lines suggest a neutral momentum phase with a tendency toward a breakdown if price fails to reclaim the cloud top near $156.
Meanwhile, Bollinger Bands on the 4-hour chart have tightened around current levels, reflecting reduced Solana price volatility. This setup often precedes sharp moves in either direction. Given the bearish tilt in momentum, the risk currently favors a continuation lower.
Why is the Solana Price Going Down Today?
Solana price dynamics (Source: TradingView)
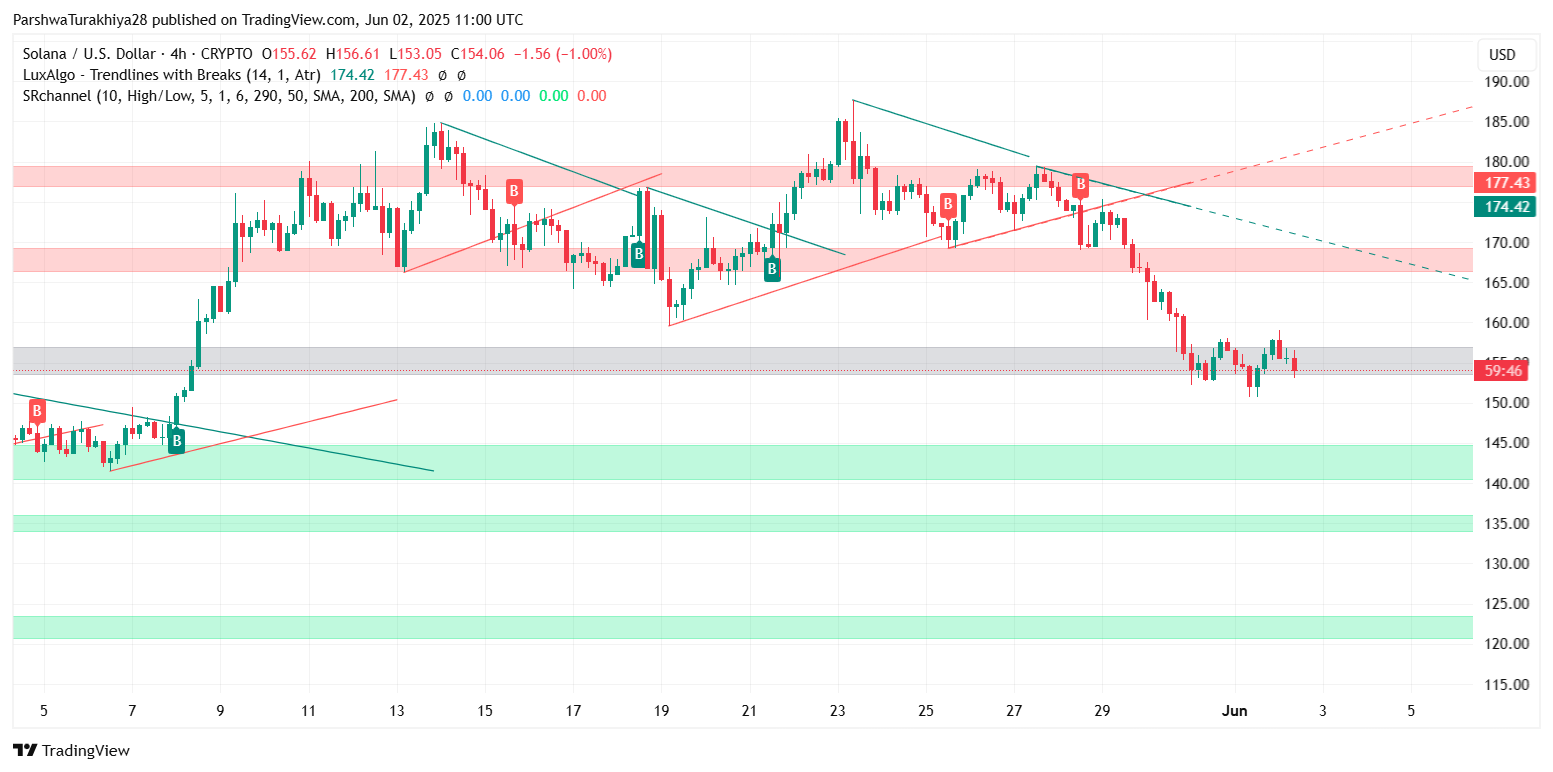
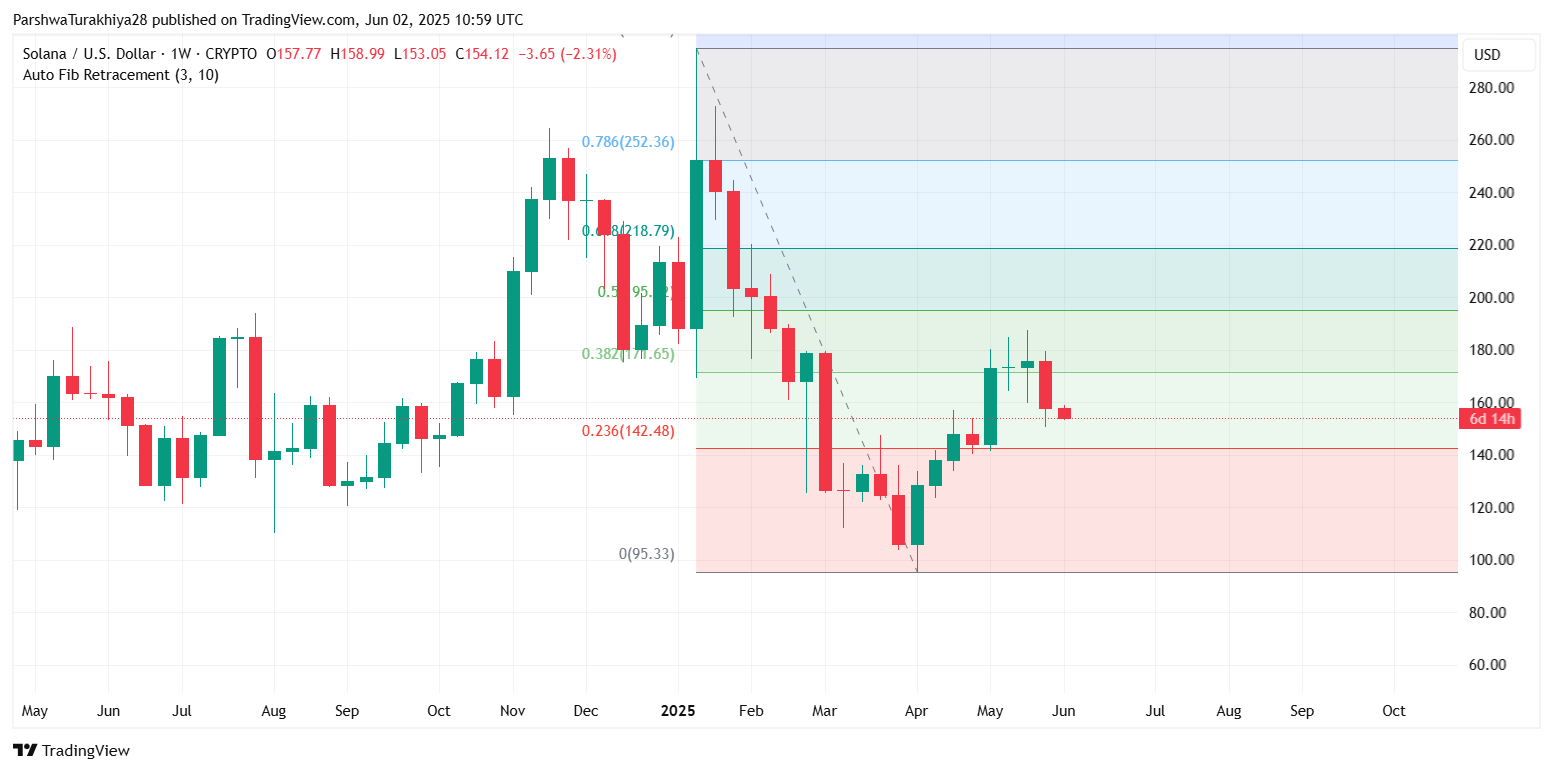
The core reason why Solana price went down today is the sustained rejection from the $160–$165 supply zone, which coincides with the 0.382 Fibonacci retracement zone around $171 on the weekly chart. This level had previously acted as a pivotal reversal area in April and May. Its failure to hold signals weakening bullish conviction.
On top of that, the weekly Fibonacci structure places the next critical support at the 0.236 level near $142. If $150 fails to hold this week, a move toward $142–$138 becomes increasingly likely, especially as sellers gain confidence from trendline rejections and EMA resistance confluence.
Solana Short-Term Forecast and Key Price Levels
Solana price dynamics (Source: TradingView)
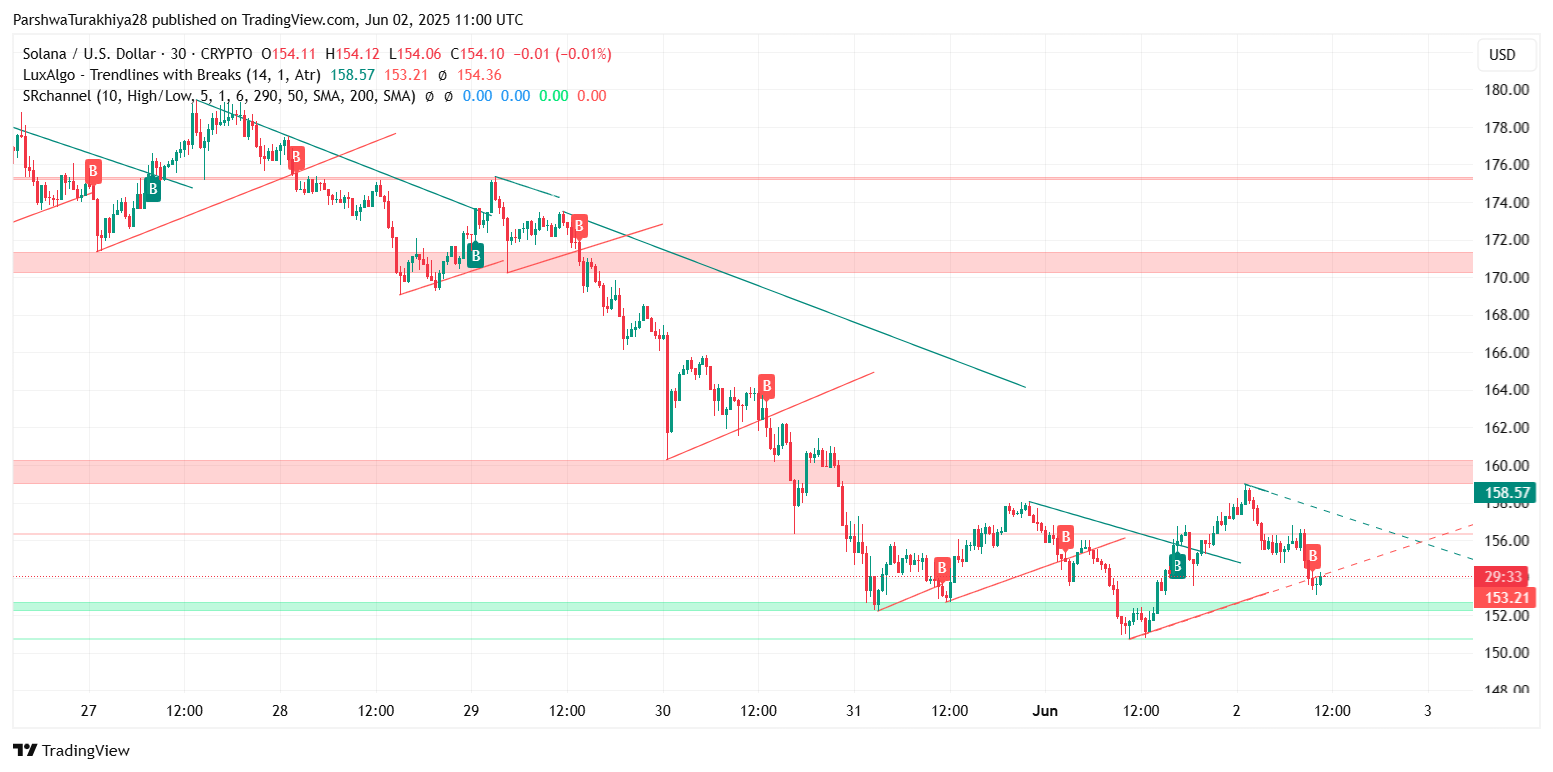
If Solana price breaches the $150 threshold on convincing volume, the next downside target lies near $142, followed by $138. Below that, a structural support base exists around $123–$125.
On the upside, bulls must reclaim $156 and then $160 for any meaningful recovery. A break above $165 would invalidate the current bearish pattern and open the door to retest $174 and possibly $180. However, without momentum reversal on indicators, that scenario remains unlikely in the near term.
With multiple failed breakout attempts and consistent lower highs, Solana is leaning toward further weakness unless bulls step in decisively near $150.
Solana Technical Forecast Table: June 3
Disclaimer: The information presented in this article is for informational and educational purposes only. The article does not constitute financial advice or advice of any kind. Coin Edition is not responsible for any losses incurred as a result of the utilization of content, products, or services mentioned. Readers are advised to exercise caution before taking any action related to the company.

 coinedition.com