
- Quant rally gains traction with the recent announcement of Quant Flow at EBAday 2025 in Paris.
- With a growing number of profitable $QNT holders, positive sentiments build up for Quant.
- $QNT's technical outlook suggests a potential breakout run to extend the monthly gains.
Quant ($QNT) trades at $119, recording an 11% surge at press time on Wednesday, following the announcement of Quant Flow at EBAday in Paris on Tuesday. With the bull run, the majority of $QNT holders are now profitable, and an optimistic technical outlook suggests a potential breakout from a high supply zone.
Quant Flow opens the gate for institutions and enterprises
Quant announced a Quant Flow feature in Overledger Fusion alongside its PayScript engine. This enhances a simple transaction with advanced programmability and automation features. At the EBAday in Paris, Gilbert Verdian, founder and CEO at Quant, shared a panel with Barclays, EPAM, and Bain & Co to discuss the future of fintechs and banks.
The announcement comes a day after the unveiling of Overledger Fusion, the world’s first layer 2.5 network for institutions, enterprises, and Decentralized Finance (DeFi) ecosystems. With the Fusion upgrade, Quant’s Overledger will gain a multi-ledger rollup technology feature, enabling the creation of a multi-chain network and improving operability across multiple layer-1 networks.
Quant rally faces supply zone at $125
Quant is up by 25% so far this week, printing its third consecutive bullish candle on the daily chart at the time of writing. $QNT’s recovery above the $100 psychological mark marks a breakout from an inverted head and shoulders pattern, signaling a trend reversal.
The pattern formed after a 64% drop from the closing price of $165.90 on December 7 to the closing price of $59.90 on April 8. A Fibonacci retracement over the mentioned 64% drop reveals a 50% halfway level at $112.90.
As $QNT surpasses the 50% Fibonacci retracement, investors must remain cautious, as players with a lower buying price could book profits. However, it also marks a trend reversal for Quant, signaling upside chances.
Supporting the reversal thesis, the Moving Average Convergence/Divergence (MACD) indicator crosses above its signal line, triggering a bullish crossover and reflecting a surge in bullish momentum. The resurfacing of positive histogram bars provides an additional boost to the thesis of trend reversal.
The 50-day Exponential Moving Average (EMA) at $89.61 exceeds the 200-day EMA at $87.75, triggering a golden cross and supporting the bull run chances as short-term price action overcomes the longer period movement.
The uptrend in $QNT nears the supply zone extending from $121 to $125, with the upper boundary coinciding with the 61.8% Fibonacci level. With an increasing number of technical signals suggesting a breakout possibility, Fibonacci levels highlight the next key resistance at $143.22, which aligns with the 78.6% retracement level.
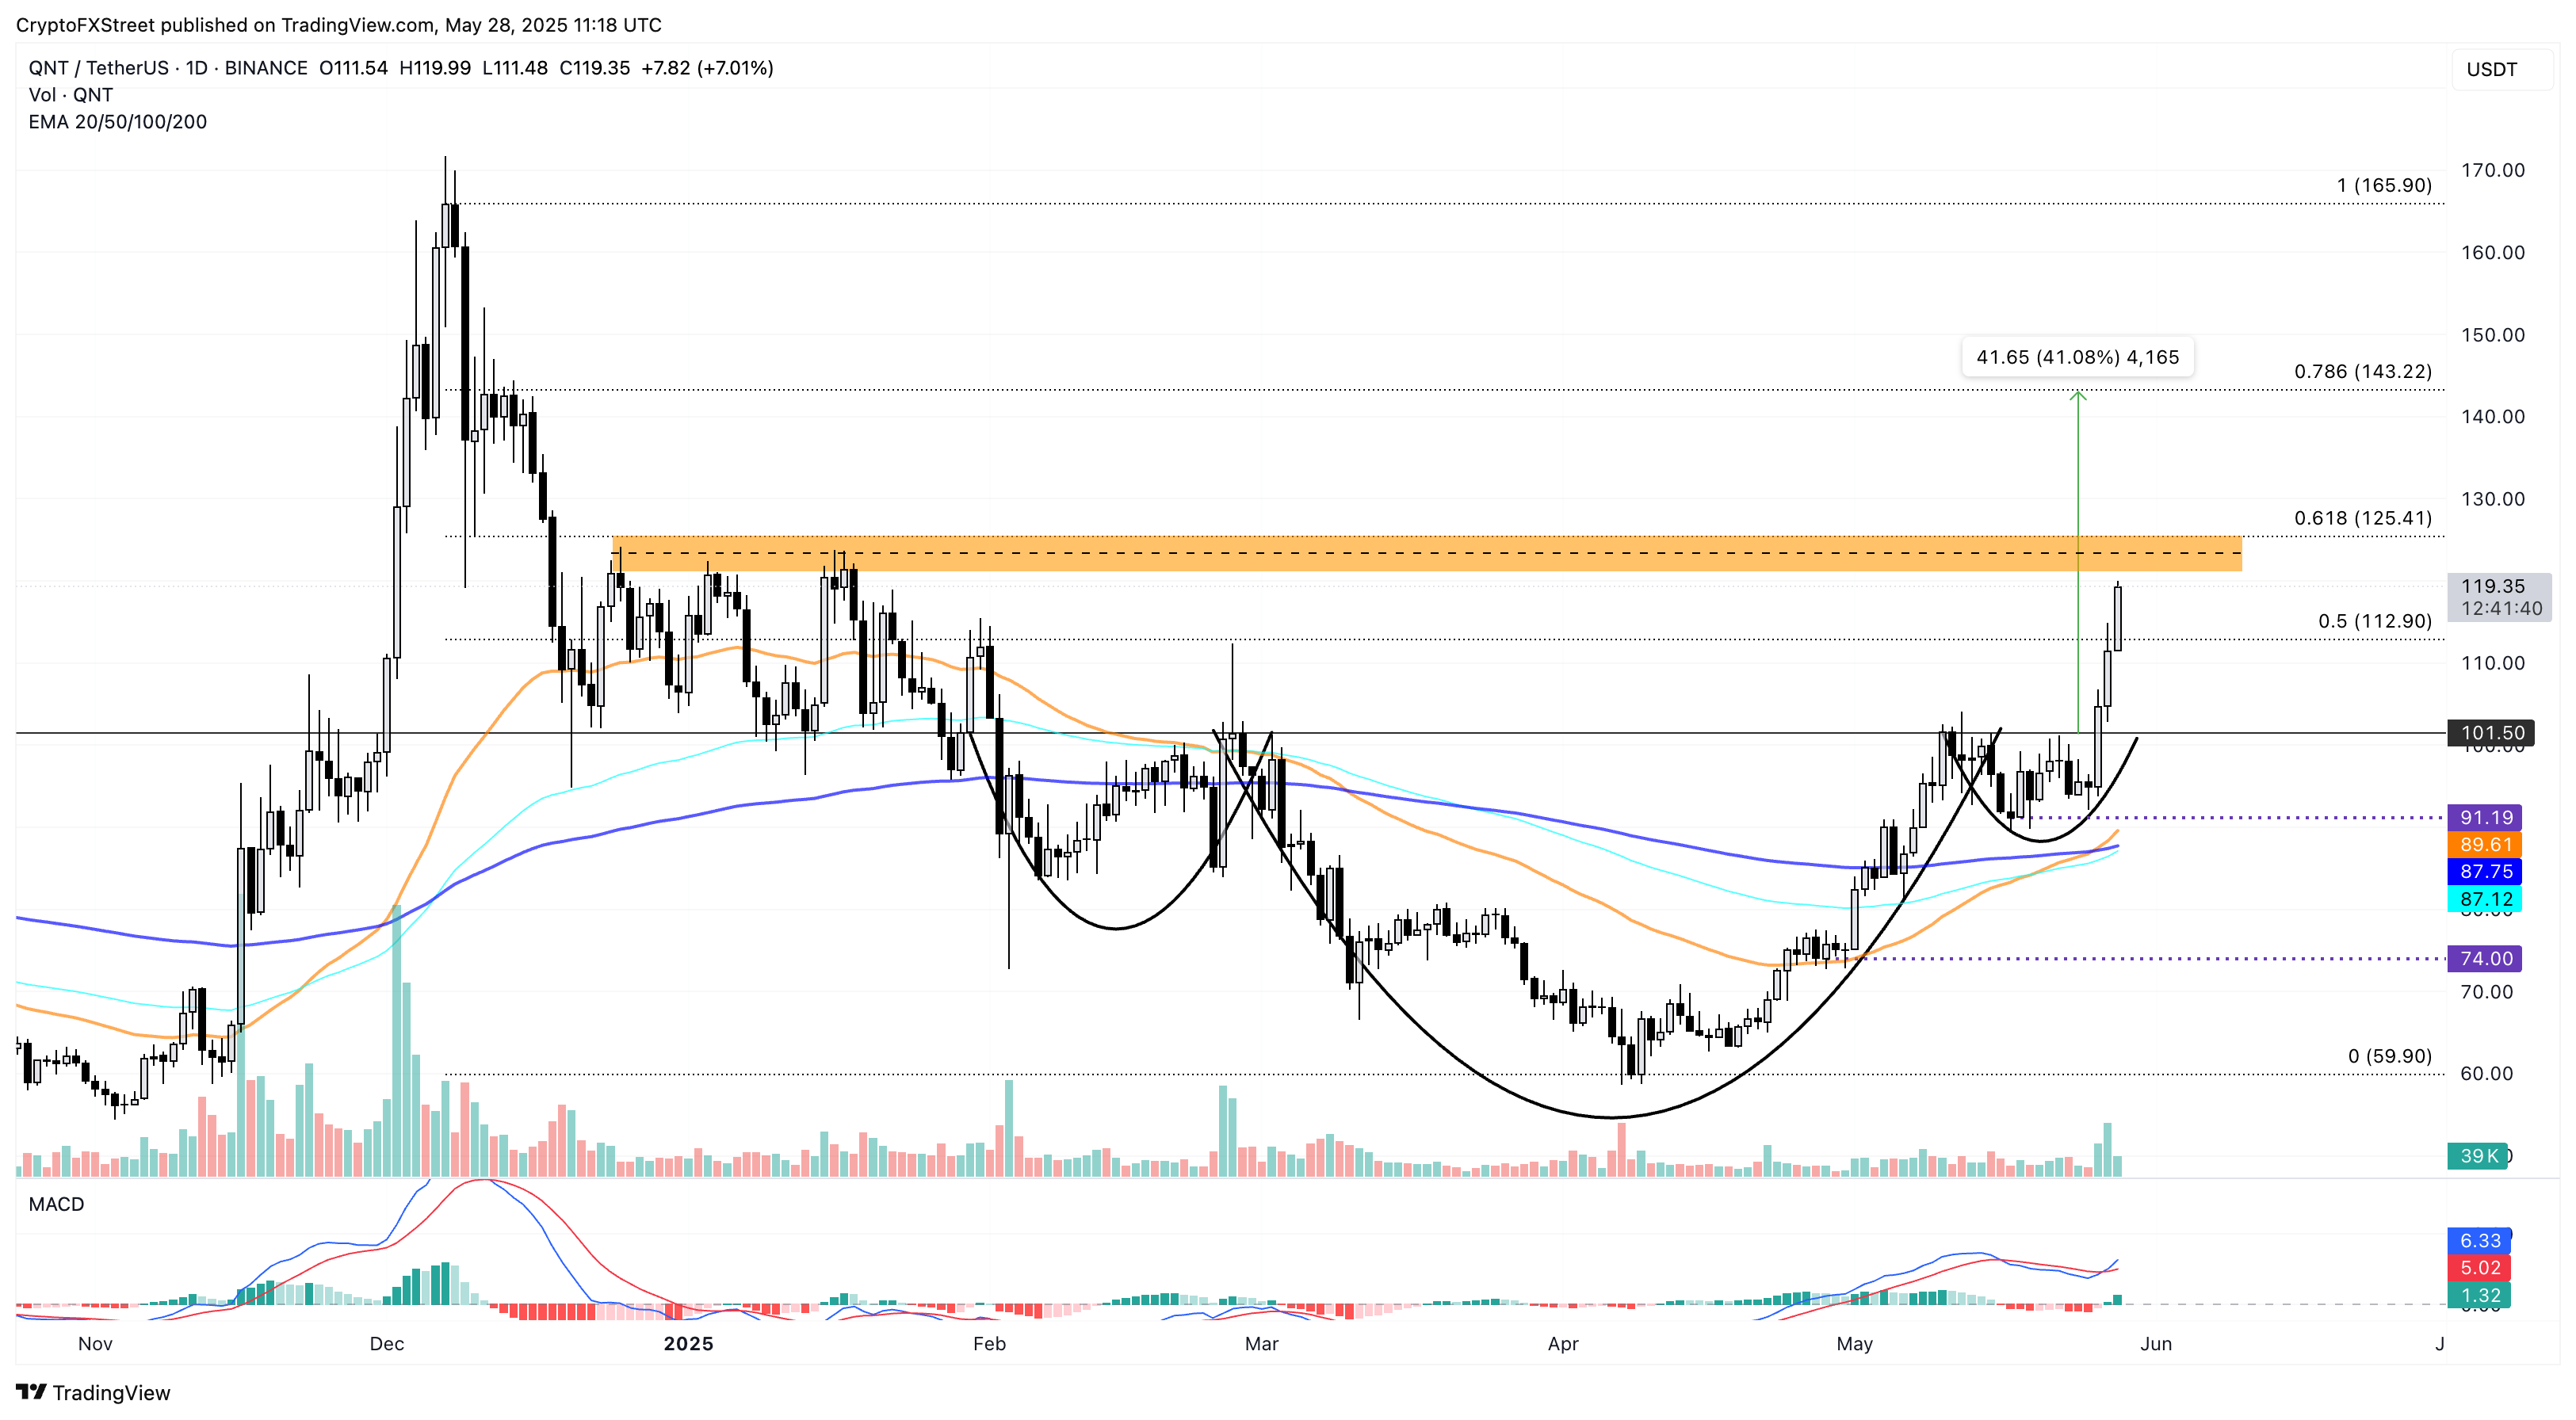
$QNT/USDT daily price chart. Source: Tradingview
Conversely, a reversal from the supply zone could result in the retest of the 50% Fibonacci retracement at $112.90.
Profitable $QNT holders to push uptrend
According to IntoTheBlock’s Global In/Out of Money (GIOM) data, 85% of $QNT holders are “In the Money” with buying pressure below the current market price. The GIOM chart reveals that 18.22K investors with a buying price between $115.62 and $124.37 hold 668.06K $QNT tokens in an “At the Money” zone.
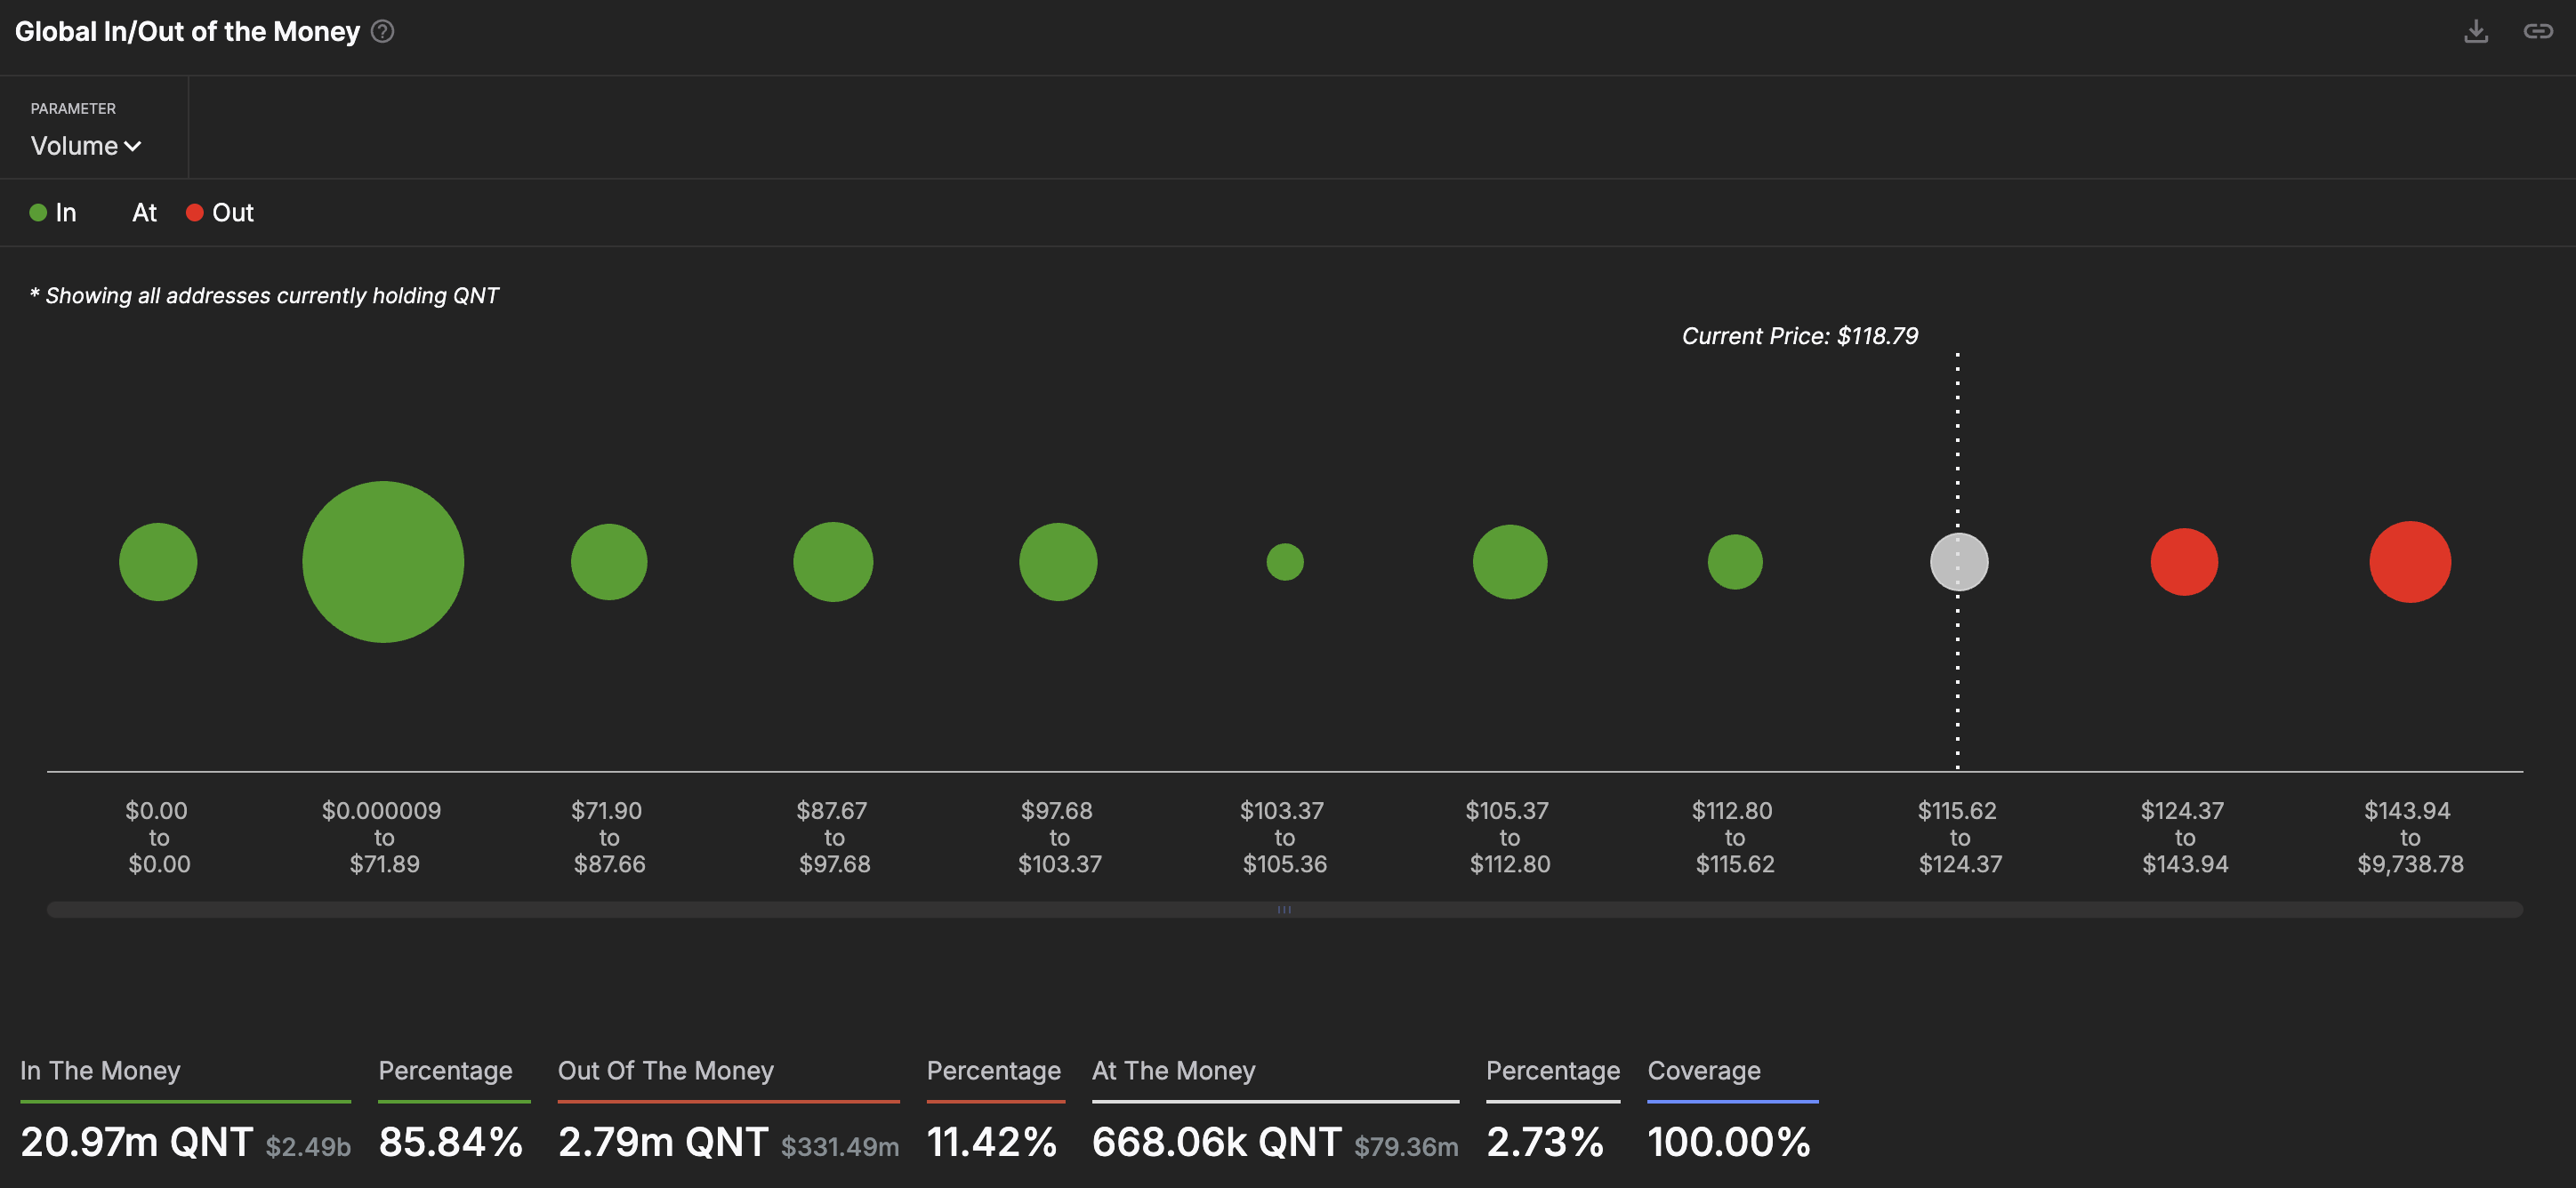
Global In/Out of the Money indicator. Source: IntoTheBlock
According to this metric, the immediate resistance zone for Quant lies between $124.37 and $143.94, with 17.87K investors holding 1.03 million $QNT tokens at an average price of $133.37. As larger participants are “In the Money,” a pullback could be absorbed by investors in profit, likely to average dollar-cost value.