u.today

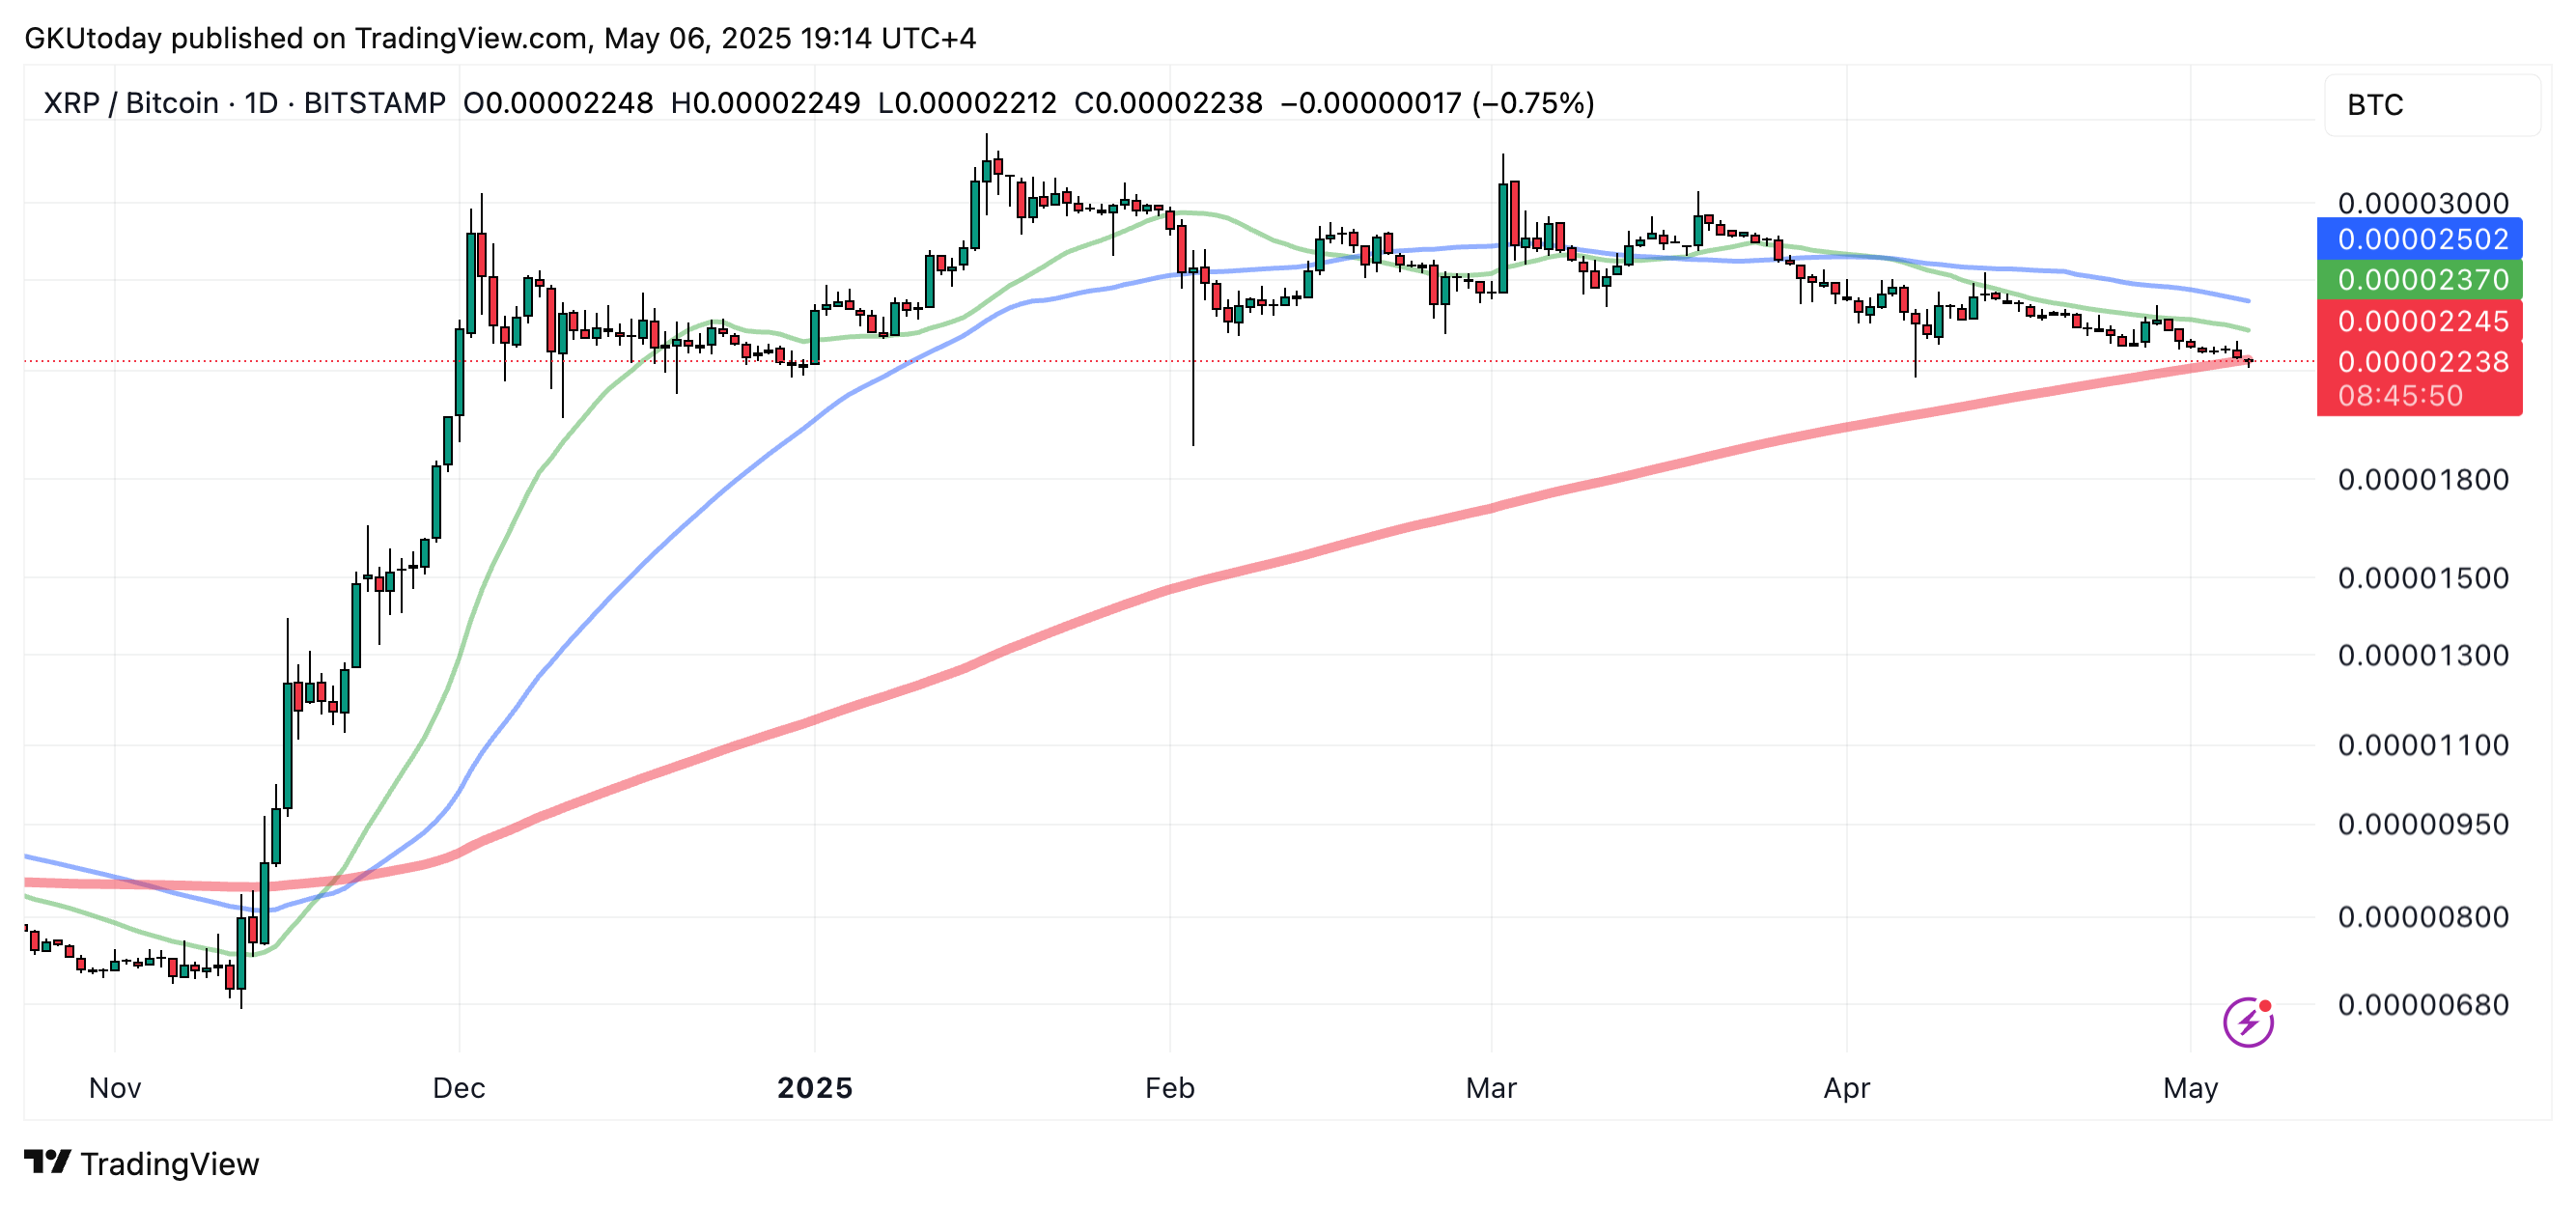
After holding firm for nearly six months, $XRP has dropped below an important price point level against Bitcoin ($BTC). If you look at the $XRP/$BTC daily chart, you will see that the price has now closed under the 200-day moving average, the red line, for the first time since Nov. 13, 2024. This is a big change after $XRP's 289% rise against $BTC during that same time.
The current daily close is at 0.00002237 $BTC, which is just under the 200-day moving average of 0.00002245 $BTC. This break puts $XRP in a weaker position, technically speaking and may signal a change in trend direction if the downturn continues.
Short-term trends are also pointing lower. Both the 23-day and 50-day curves are now in a descending pattern. If they keep going and go below the 200-day moving average, traders might see several death cross formations all at once. In chartists' talk, these crossovers are usually seen as bearish signs.