
Toncoin ($TON), the native asset of The Open Network, is back in focus after a long downtrend. Once trading well above $5, $TON has been consolidating under the $3.50 mark for weeks, but recent price action suggests a possible change in momentum. Backed by improving technicals, rising volume, and renewed investor interest, Toncoin price may be heading toward a breakout phase. Let's dive deep into the latest chart data to uncover what's really going on.
Toncoin Price Prediction: Can $TON Break Past Resistance?
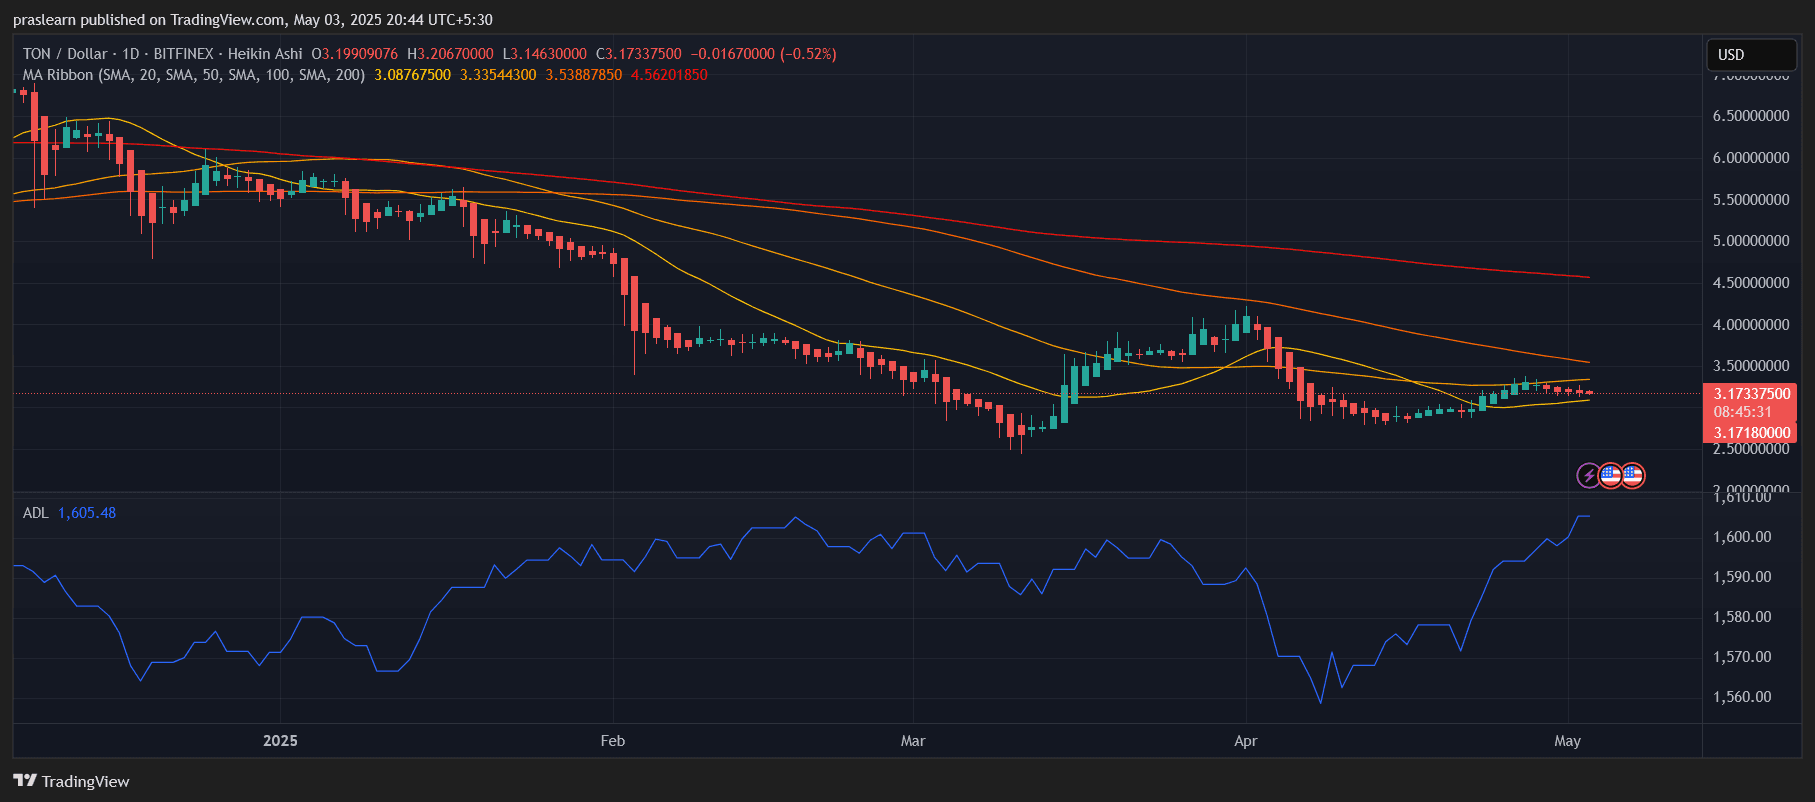
On the daily chart, $TON price is currently trading near $3.17, attempting to recover from its sharp decline earlier this year. The price is hovering around a confluence of major moving averages. The 20-day SMA ($3.08), 50-day SMA ($3.33), and 100-day SMA ($3.53) are tightly packed, creating a resistance zone $TON has been struggling to clear. This compression often precedes explosive moves.
The key bullish sign is that $TON price has managed to stay above the 20-day SMA, forming a short-term higher low pattern. The Advance-Decline Line (ADL) is rising steadily, showing improving market breadth and buyer dominance. However, the 200-day SMA at $4.56 looms large, signaling that any meaningful breakout must push beyond $3.50 first to test the longer-term trendline.
Hourly Chart Signals: Bullish Reversal or False Alarm?
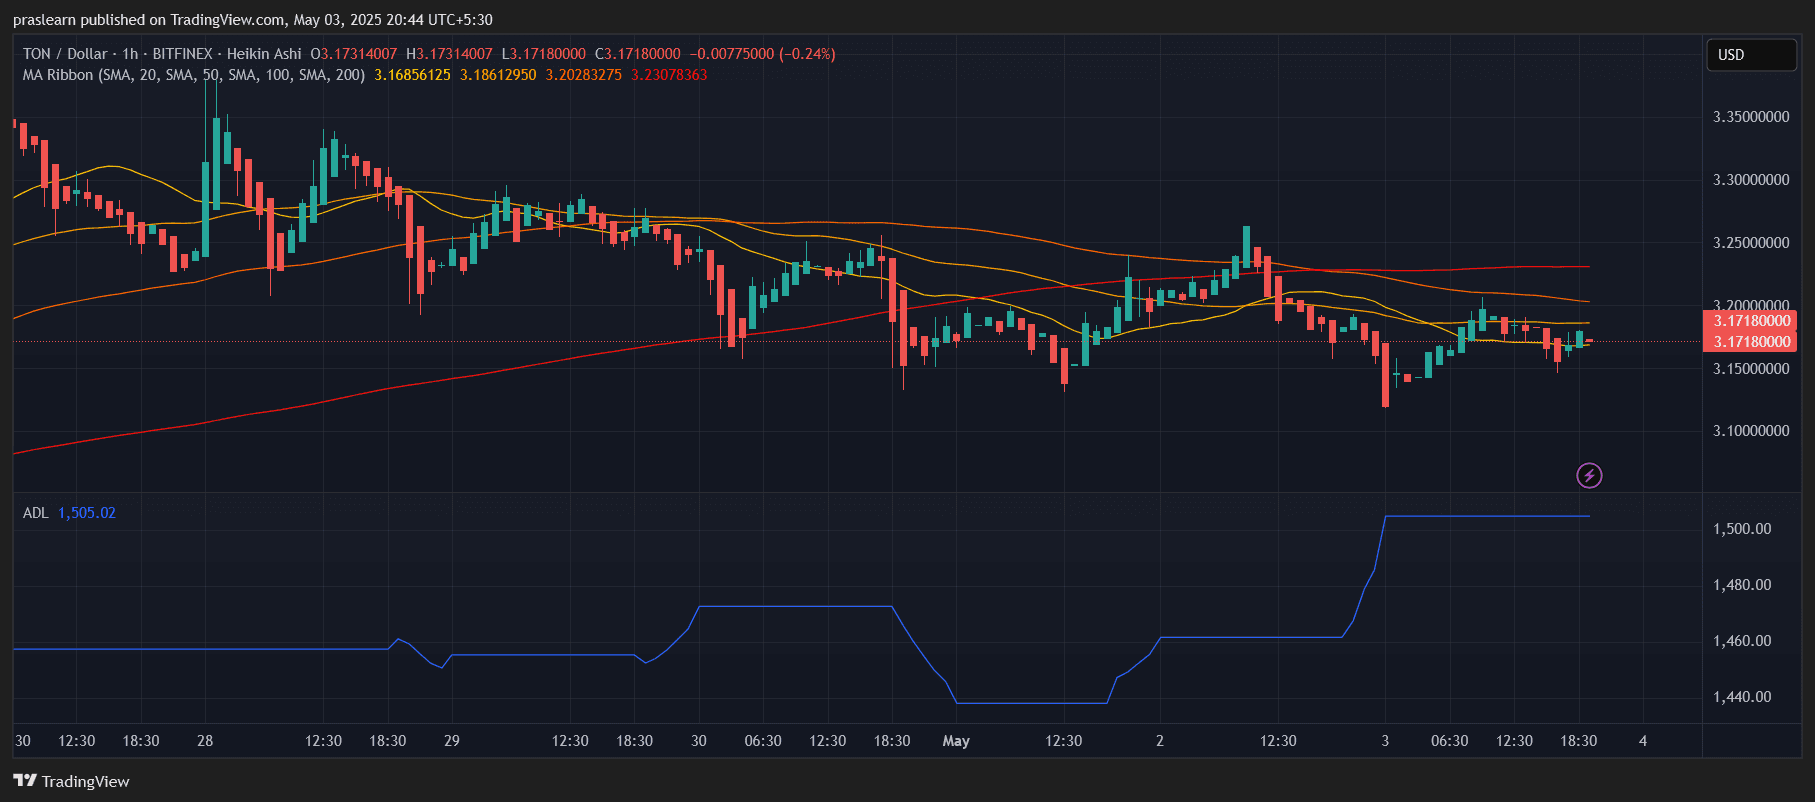
Zooming into the hourly chart, $TON price appears to be forming a minor ascending triangle pattern — a bullish continuation setup. The price is testing resistance near $3.20, and all short-term moving averages (20, 50, 100, and 200 SMA) are converging in a tight band between $3.17–$3.23. This setup often acts like a coiled spring — a break above the resistance could trigger a quick move toward $3.35 or even $3.50.
The ADL on the hourly chart is flat but recently ticked higher, suggesting accumulation. If we see increased volume and a clean hourly candle close above $3.25, it could mark the beginning of a short-term rally.
What's Driving Toncoin's Momentum?
Toncoin’s ecosystem has been expanding with recent DeFi integrations and NFT launches, all of which contribute to stronger fundamentals. Additionally, the broader Layer-1 narrative has been gaining traction, giving renewed hope to projects like $TON that were previously overshadowed.
Another key factor is market psychology. With many altcoins recovering, $TON’s long period of consolidation under $3.50 is beginning to look like a base-building phase. Traders are watching for confirmation through volume and breakout candles.
Key Levels to Watch
The immediate resistance lies at $3.25, followed by $3.50, which also aligns with the 100-day SMA. On the downside, $3.00 remains a psychological and structural support level. A close below that would invalidate the bullish structure and expose $TON to a pullback toward $2.80.
If $TON price breaks $3.50 with strong volume, the next target lies at $4.00, a round-number resistance and previous breakdown level from February. This would represent a 25% upside from current levels.
Toncoin Price Prediction: 30-Day Price Forecast
Assuming continued strength in altcoins and Bitcoin holding above key levels, Toncoin price could realistically target the $3.50–$4.00 zone within the next 30 days. However, that hinges on broader market stability and $TON’s ability to close above $3.25 with volume confirmation.
If bearish pressure resumes, a drop to $3.00 or even $2.80 could unfold quickly. Risk management is key.