XRP is trading at $2.198 to $2.22 over the last hour, with a total market capitalization of $129 billion, as bullish forces edge the price closer to the key resistance zone. With a 24-hour trading volume of $4.17 billion and an intraday range of $2.13 to $2.25, traders are eyeing a potential continuation of momentum amid broader crypto market strength.
XRP
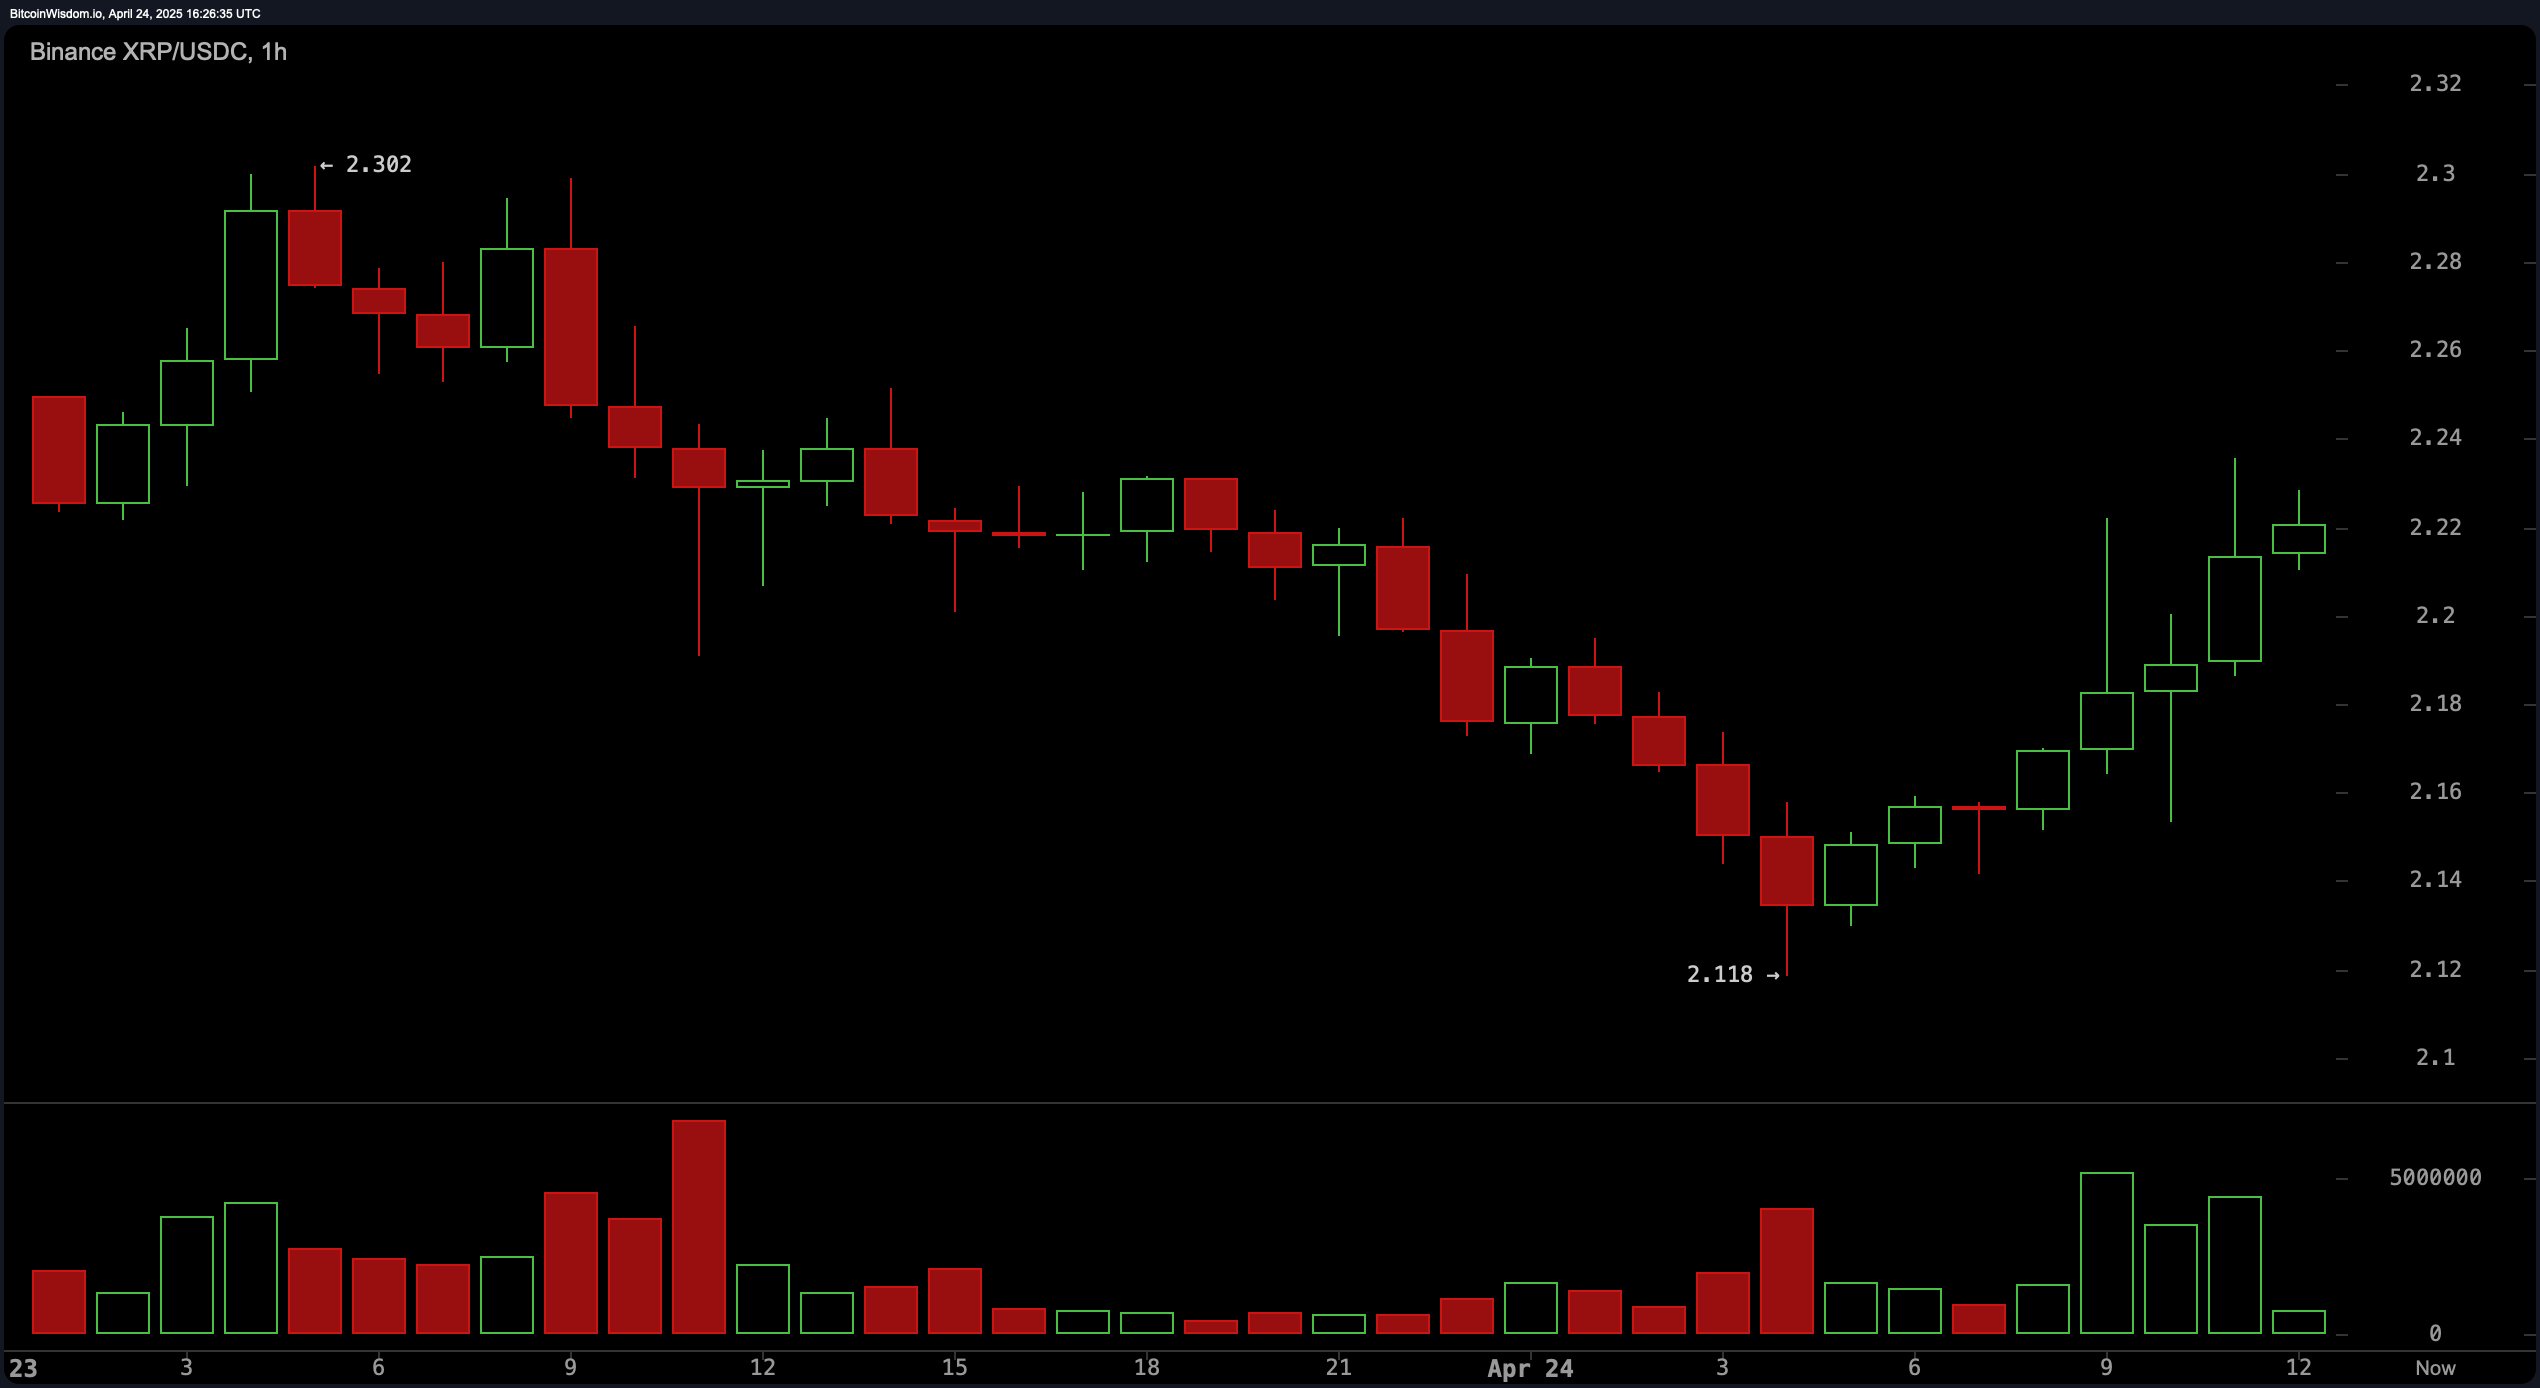
On the 1-hour chart, XRP has broken a prolonged midterm downtrend, posting a notable higher low at $2.118 and rallying to a higher high above $2.22. This reversal is indicative of strengthening bullish momentum, especially with current price action consolidating above $2.20. The Fibonacci retracement levels further confirm this sentiment, with a reversal kicking in at the 61.8% level around $2.188 and a subsequent push to the 0% retracement at $2.302. Traders looking to position within this timeframe might consider a breakout confirmation above $2.24 with tight risk controls near $2.17.
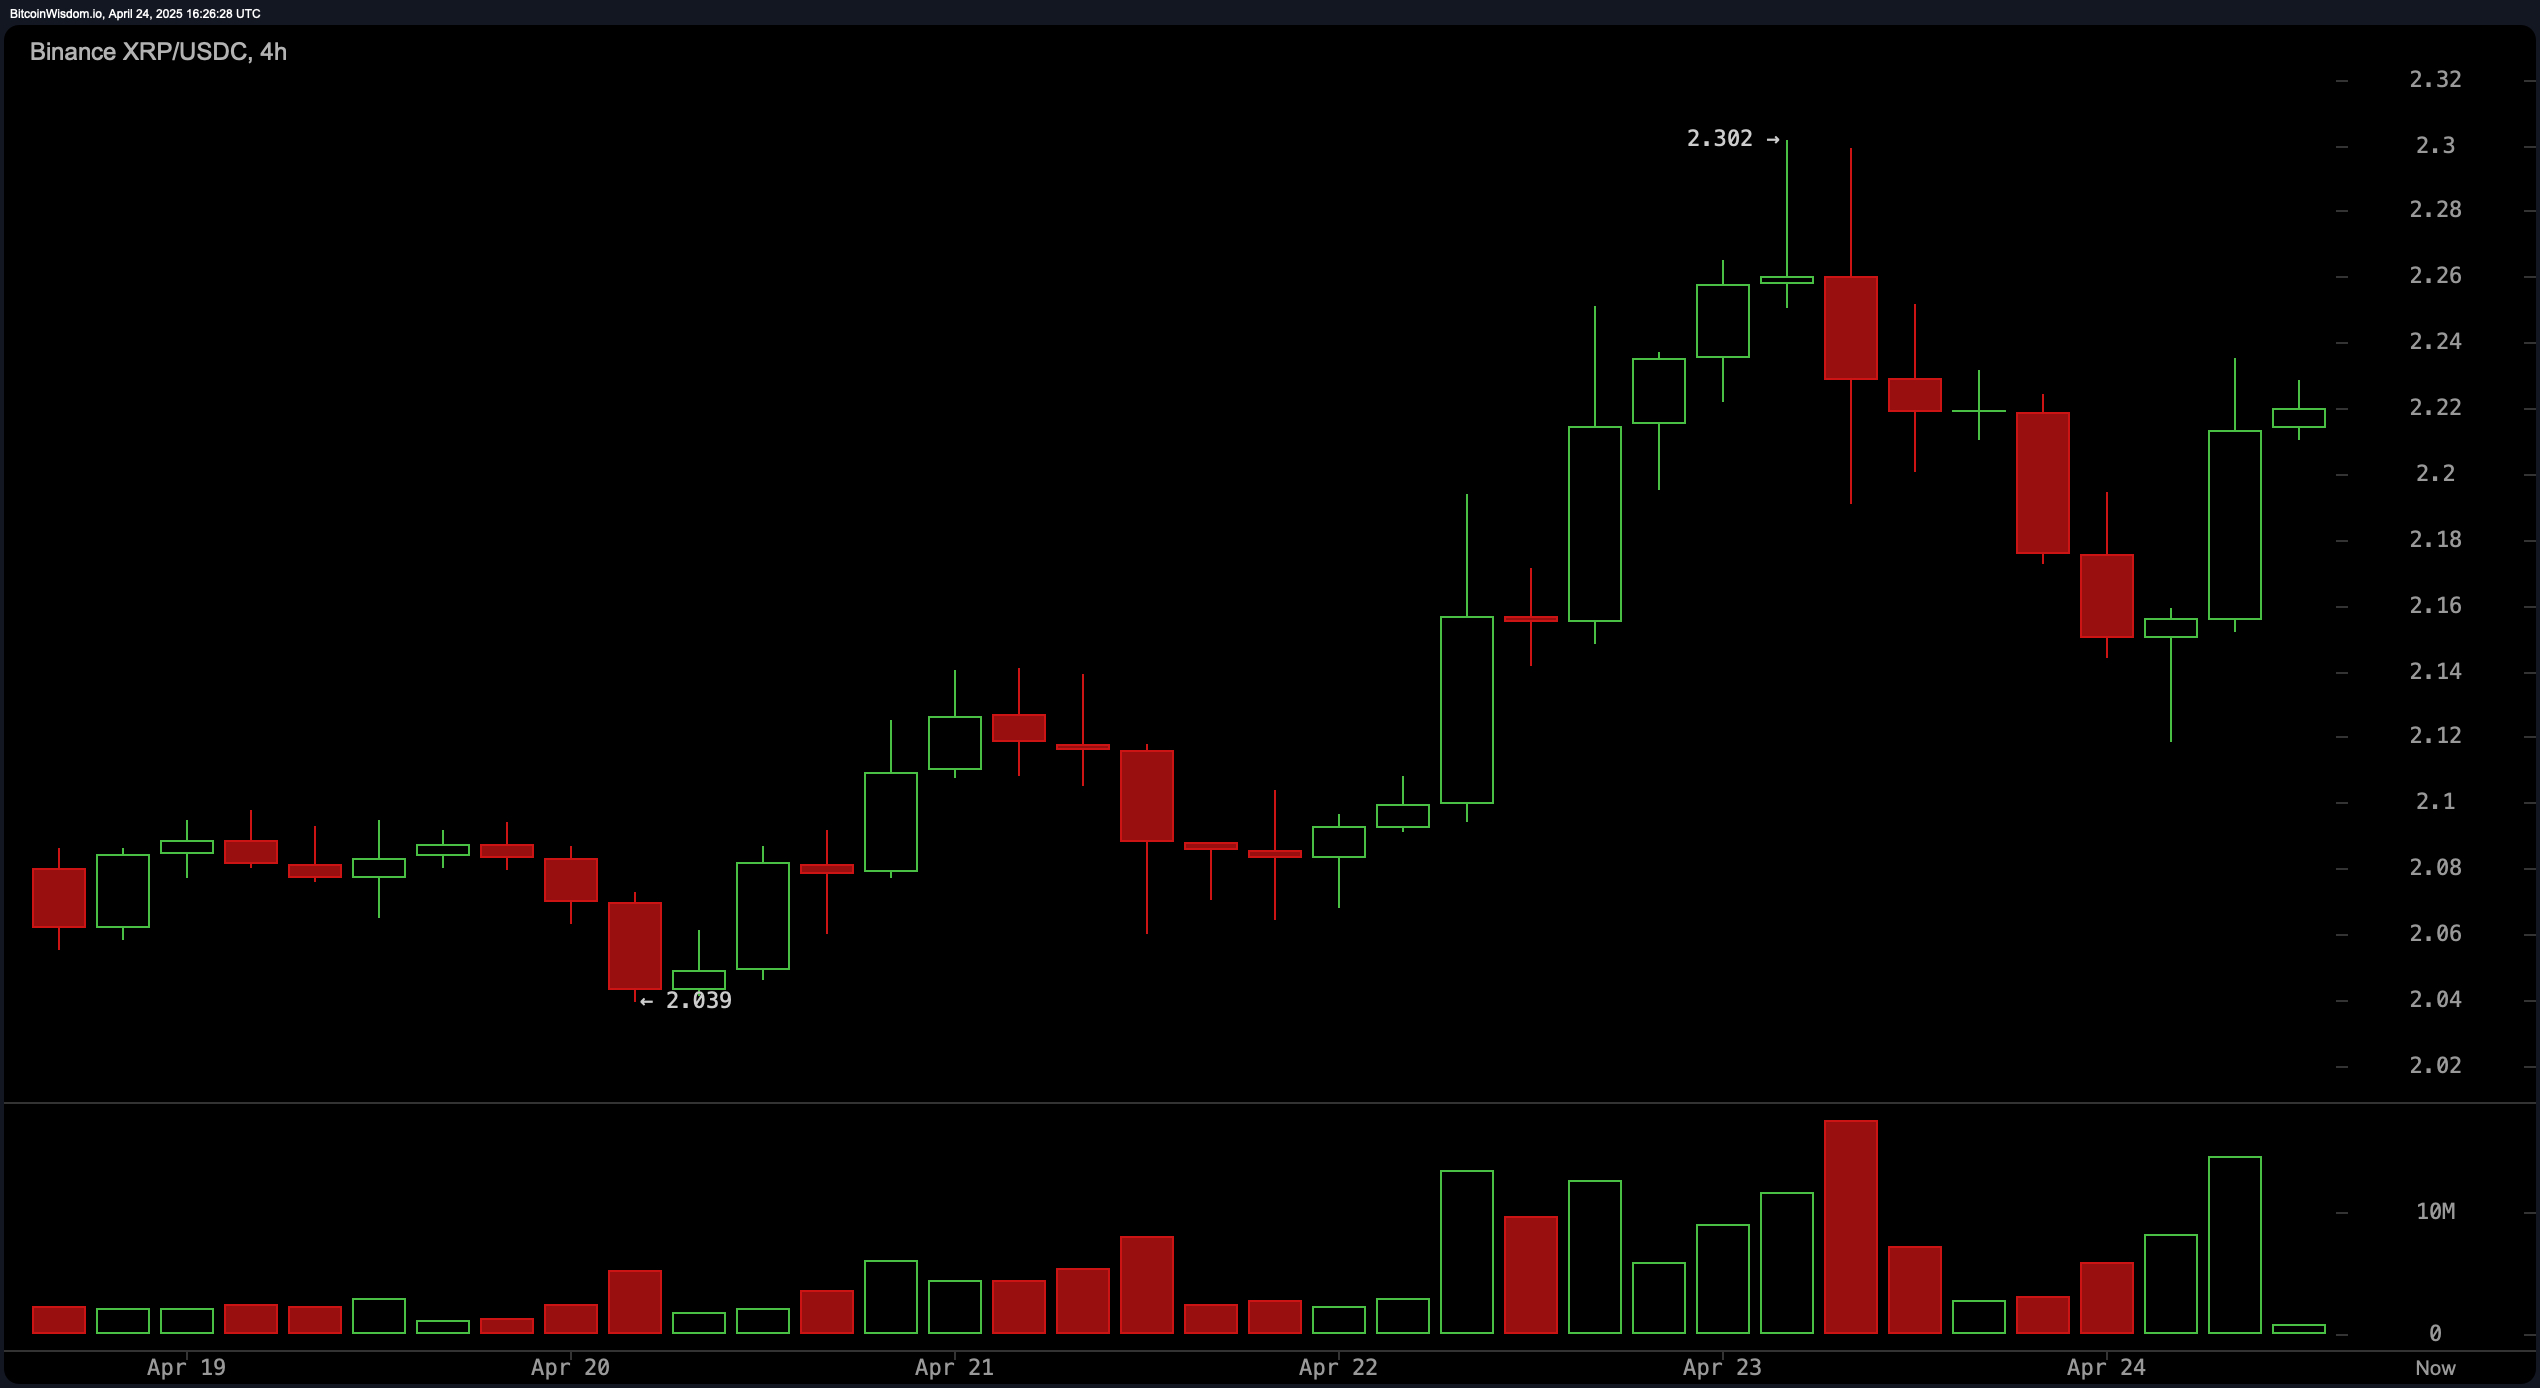
The 4-hour chart reveals a short-term uptrend that began at $2.039 and peaked at $2.302, followed by a modest pullback and a renewed bounce attempt. The recent bullish candle printed near $2.15–2.18 suggests a resurgence of buying interest at a classic retracement zone. Price currently oscillates around the 50% to 61.8% Fibonacci levels ($2.171–2.139), often associated with buy-the-dip opportunities. If XRP can reclaim and hold the 23.6% retracement near $2.24, an advance toward $2.30 and potentially $2.40 may be within reach.
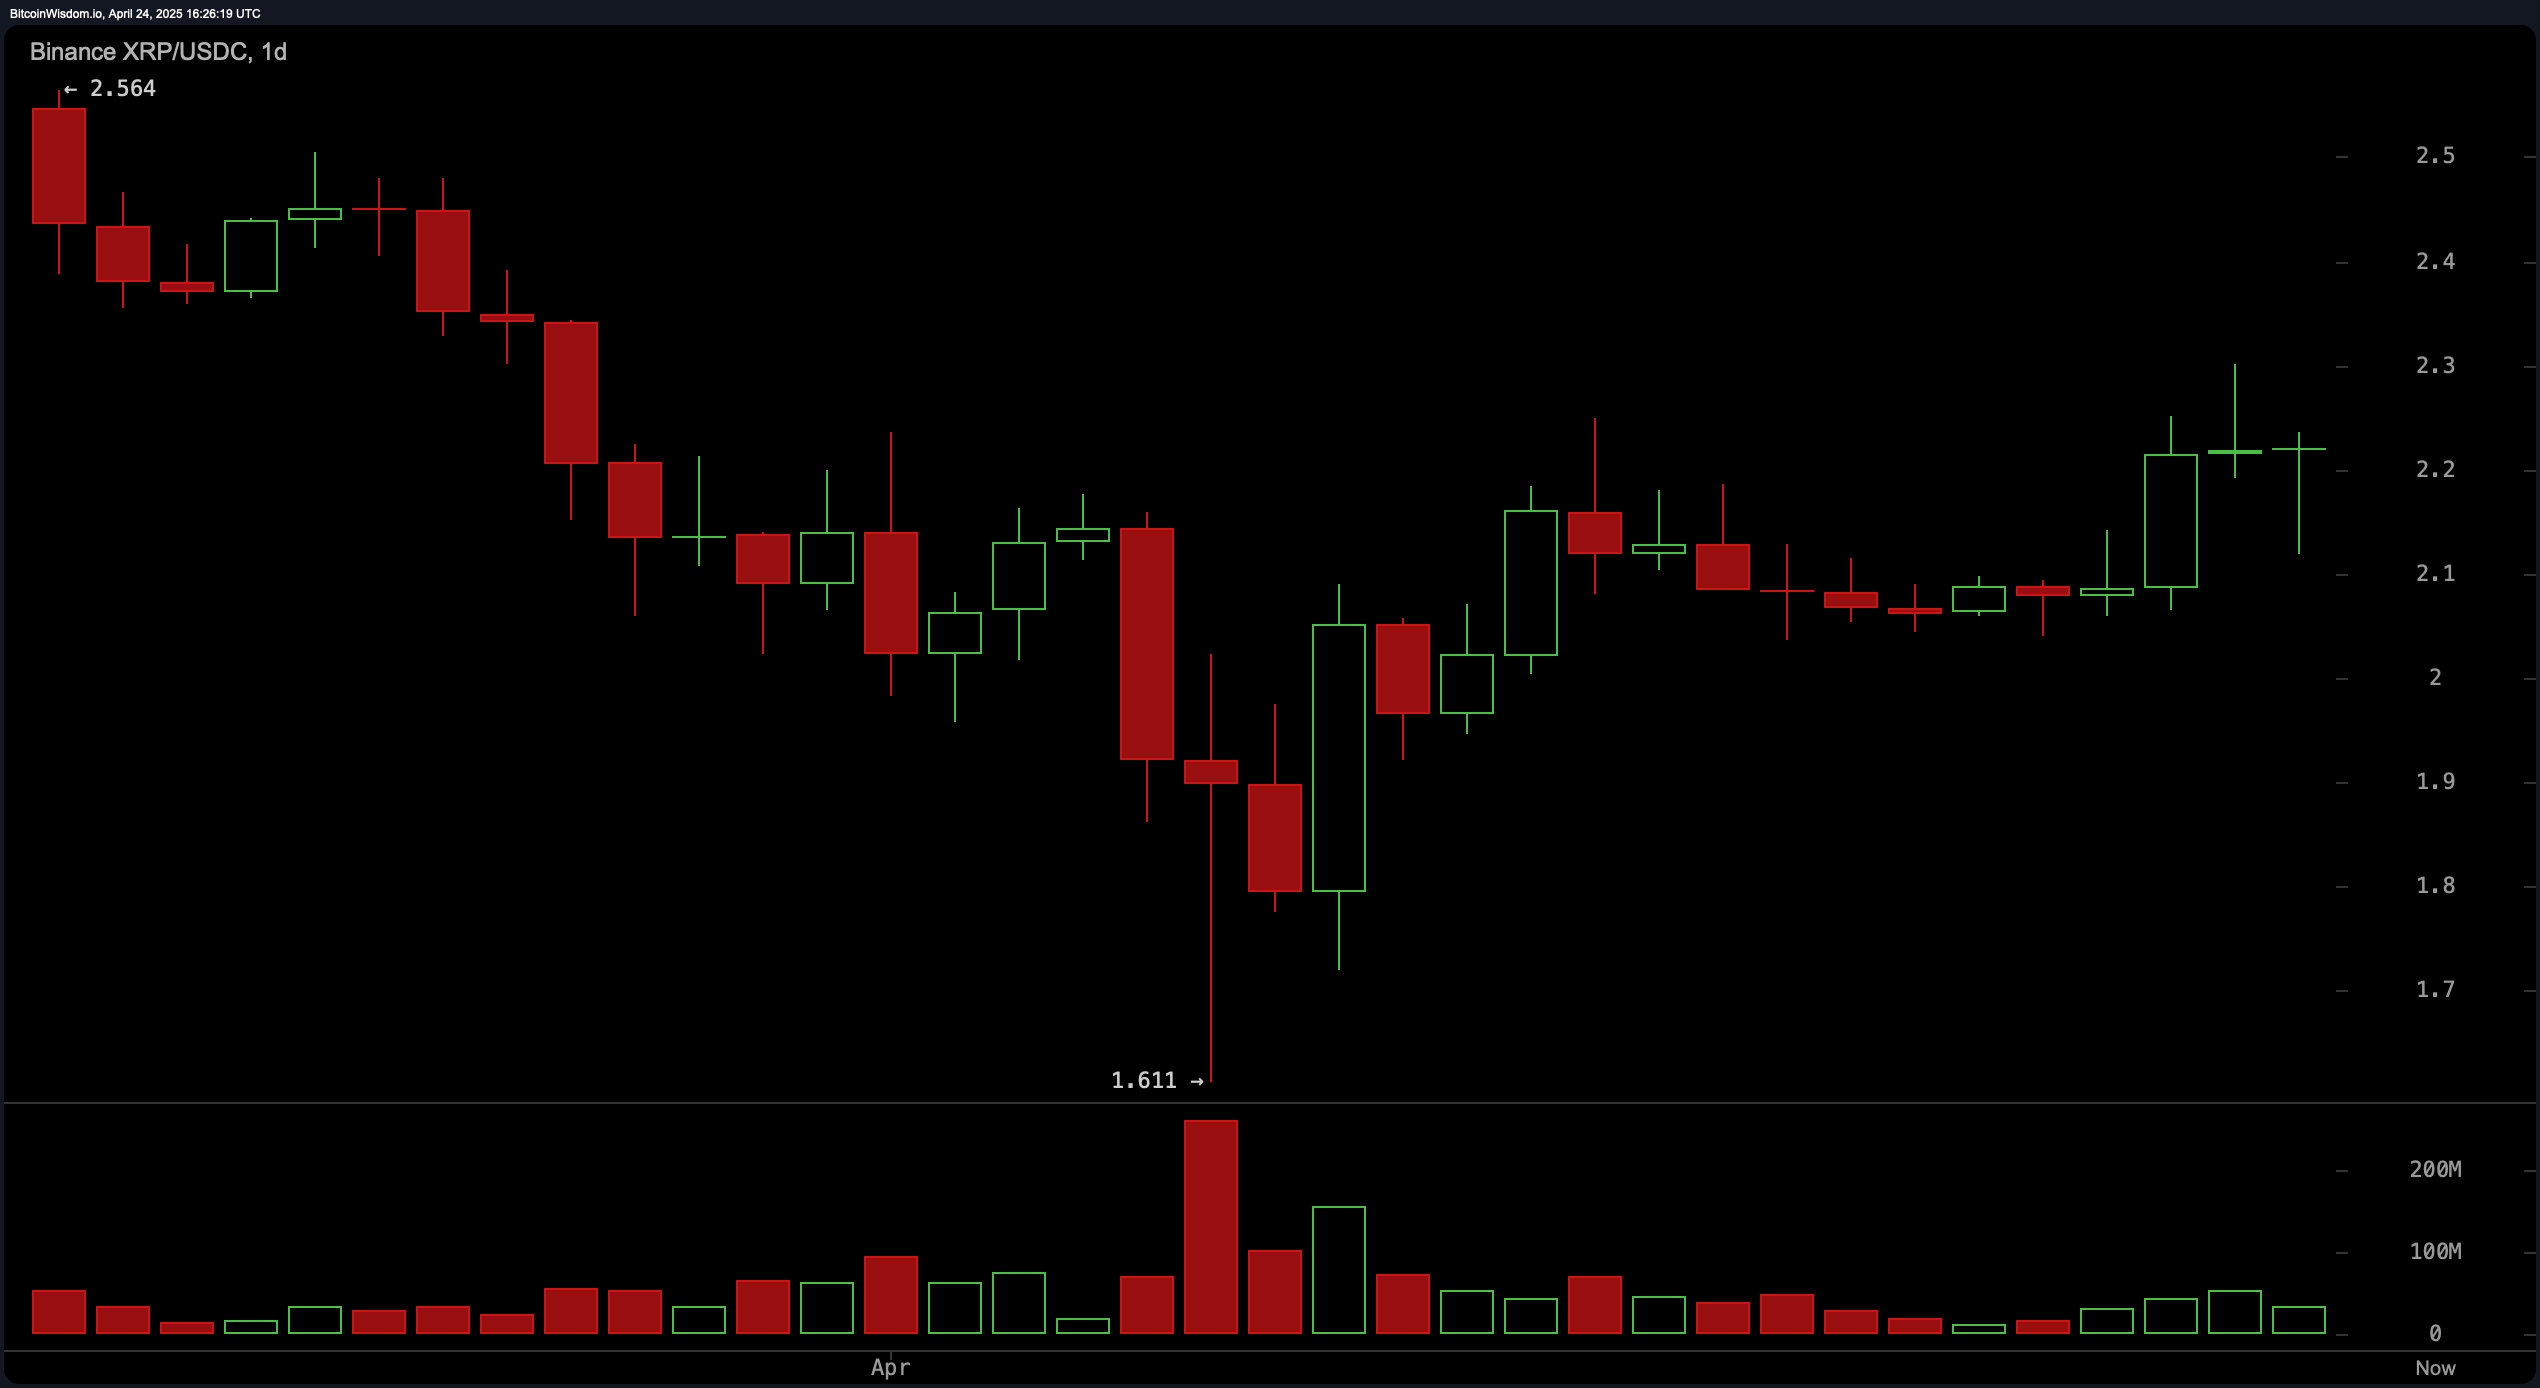
On the daily chart, XRP shows signs of stabilization following a prior downtrend, marked by a bottoming wick at $1.611. Price has rebounded strongly and is now locked in a consolidation phase between $2.20 and $2.30. Fibonacci analysis suggests the price is hovering around the 38.2% retracement level at $2.200, which typically acts as a pivot for trend continuation or rejection. Sustained movement above this threshold, especially on increased volume, could confirm accumulation and prime the asset for a bullish breakout above the $2.30–2.40 resistance zone.
Oscillator analysis reveals mixed signals. The relative strength index (RSI) at 55.79804 and the Stochastic at 82.52177 both suggest neutral conditions. The commodity channel index (CCI), however, signals negativity at 102.56454, while the momentum also reflects a bearish outlook at 0.09015. Conversely, the Awesome oscillator indicates a buy at 0.00992, and the moving average convergence divergence (MACD) level of −0.00253 also gives a buy signal. The average directional index (ADX) at 17.17296 is low, suggesting trend strength remains modest. These conflicting readings suggest that momentum is forming, but confirmation remains necessary before entering aggressive trades.
The Elliott Wave structure on the 1-hour chart outlines a completed five-wave impulse sequence, culminating in a final high at $2.302. This textbook pattern implies that the current price action might enter an ABC corrective phase unless extended bullish momentum emerges. Wave 1 began at $2.118 and rose to $2.188, followed by a shallow correction in Wave 2 to $2.157. The powerful Wave 3 pushed to $2.259, corrected to $2.210 in Wave 4, and concluded with Wave 5 peaking at $2.302. Any correction from this level should find support around the $2.17–2.20 range, aligning with Fibonacci and structural confluence zones.
The Fibonacci retracement levels further substantiate key decision points across all timeframes. On the daily chart, the 38.2% level at $2.20 has become a fulcrum for current price action, while the 4-hour chart confirms a rebound within the golden pocket between 50% ($2.171) and 61.8% ($2.139). The 1-hour chart’s short-term retracement analysis reveals that the bounce from the 61.8% level at $2.188 is part of the larger bullish structure, reinforcing the potential for a breakout if XRP reclaims $2.24 and holds.
Moving averages (MAs) across multiple intervals heavily favor the bulls. The exponential moving averages (EMA) and simple moving averages (SMA) across the 10, 20, 30, and 50-periods are all flashing buy signals, with the 50-period EMA at 2.19895 and SMA at 2.19702 underscoring current price strength. However, the 100-period averages have turned bearish, with the 100-period EMA at 2.21870 and SMA at 2.45574 both issuing bearish signals—reflecting possible overhead resistance. The 200-period moving averages remain supportive, with the EMA at 1.97039 and SMA at 1.97407 both aligned bullishly. These signals together point to a market that is trying to transition into a sustained uptrend, pending confirmation through a decisive move above $2.30.
Bull Verdict:
If XRP successfully reclaims and maintains price action above $2.24—especially with increasing volume—and decisively breaks through the $2.30 resistance level, the bullish case strengthens substantially. The alignment of buy signals from key short-term and medium-term exponential and simple moving averages, coupled with the bullish impulse structure confirmed by Elliott Wave theory, suggests a potential extension toward $2.40 or beyond.
Bear Verdict:
Failure to sustain above $2.20–$2.24 and a rejection at or below $2.30 may trigger a short-term correction, particularly if selling volume escalates. The presence of bearish oscillator signals like the commodity channel index (cci) and momentum (10), alongside the bearish 100-period moving averages, could signal a return to support zones near $2.14 or even a retest of the broader support range around $2.00–$2.10.
Final Take Verdict:
XRP sits at a pivotal technical juncture with $2.20–$2.24 acting as a key battleground. The bullish structure is forming, but traders must watch for confirmation above $2.30 or signs of rejection that could invite a deeper retracement. While the odds lean slightly bullish in the short term, the next few sessions will be critical in defining the trend’s direction.