$HYPE is flashing strong bullish signals as it nears a breakout from a falling wedge pattern.
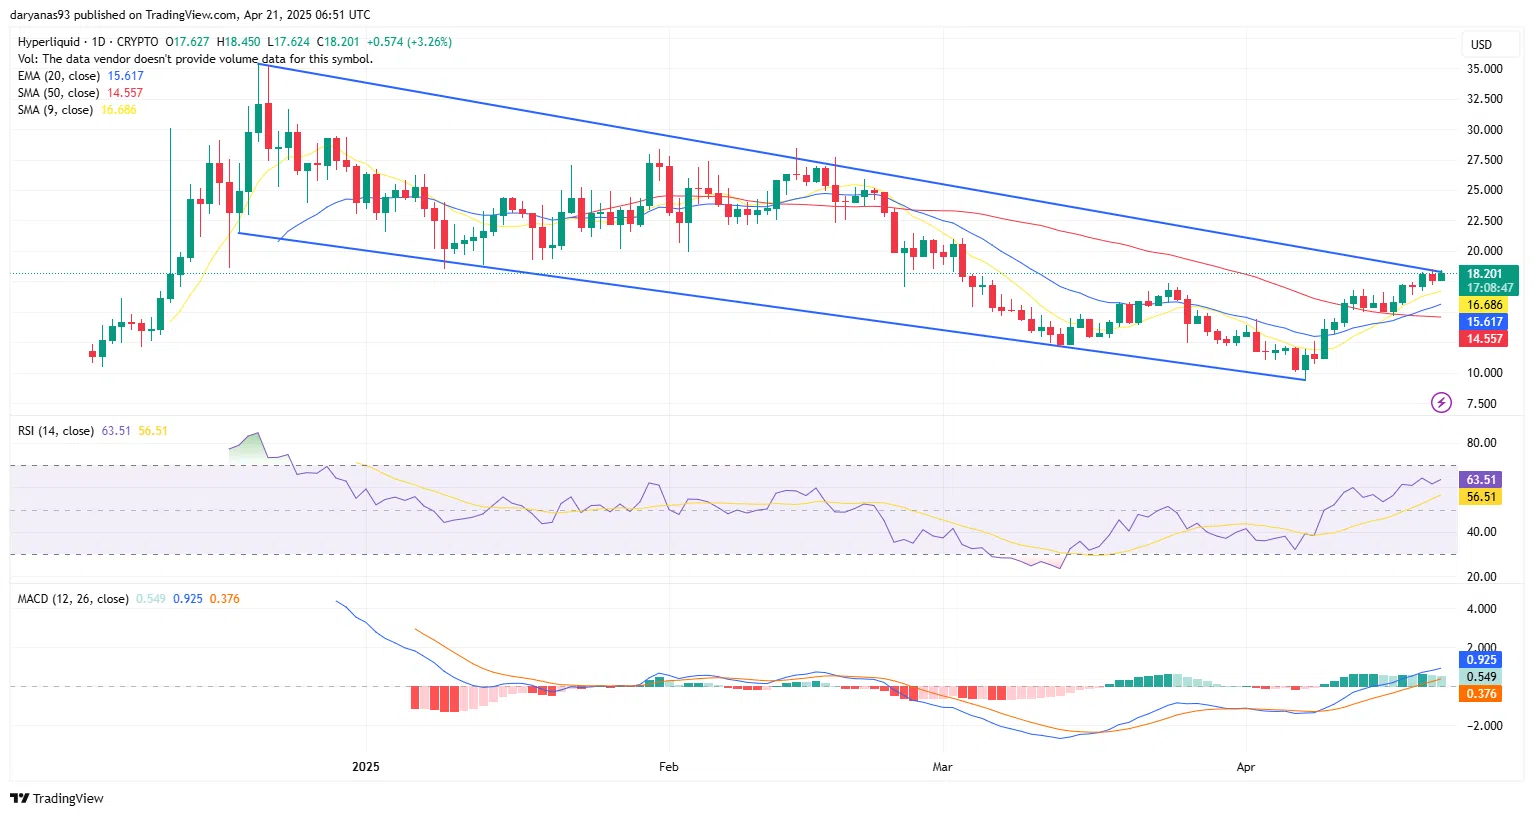
Hyperliquid ($HYPE) is showing strong bullish momentum as it’s currently on the verge of breaking out of the falling wedge formation and trading above the key moving averages — including 20-day Exponential Moving Average, 9-day Simple Moving Average, and 50-day Simple Moving Average.
After reaching its all-time high of $35.02 on 21 December, $HYPE price price entered a downtrend, carving out a falling wedge formation. The price bottomed near $9 on April 7, touching the wedge’s lower trendline before then bouncing and testing the previous resistance at around $17.30. Since then, it has climbed above all major moving averages, including SMA 9, EMA 20 and, SMA 50. The 20 EMA and 50 SMA just had a bullish cross, signaling trend reversal.
The RSI is currently sitting at 63.51, indicating that bullish momentum is picking up. MACD also shows bullish crossover, with both lines above zero.
 $HYPE price tracks toward $20 as bullish pattern signals major comeback - 1">
 If $HYPE holds above $18, the next major resistance lies at the psychological $20 level, which also aligns with the zone where the price was supported multiple times throughout January and February until it broke lower in early March.
Once $20 is cleared, the next key resistance to watch is around $26 — where the upper trendline meets with the lower high that formed in mid February.
If the wedge breakout is confirmed and the price holds above $18 with increasing volume, a longer-term target of $35 becomes possible — aligning with the origin of the upper trendline of the falling wedge.
The bullish thesis would be invalidated if $HYPE fails to hold above the $18 support zone, especially on increasing sell volume. A breakdown back below the 50-day SMA and 20-day EMA would suggest a loss of momentum and could open the door for a retest of the $17.30 level or even a move back toward the wedge’s lower trendline near $12–$13.