
The formation of a double bottom on the daily chart indicates bullish reversal potential for the PEPE token. The meme coin price is at $0.0000007385, an intraday increase of 1.43%.
With Bitcoin jumping above the $84,000 mark, the altcoin pack, including PEPE, has started to show positive momentum. Will this drive the PEPE price to a new upswing?
PEPE Technical Analysis
The PEPE price action in the daily chart shows a descending channel that has been in place since February 2025. After spiking to about $0.000014 in January, the price had a significant correction.
The downfall accounted for roughly 60% amid the broader market pullback and uncertainty. However, a recent double bottom formation just above the $0.000005681 level suggests the possibility of a trend reversal.
The current price action shows a minor consolidation between the double bottom baseline of $0.000005681 and the neckline resistance of $0.00000888. This consolidation, coupled with the formation of recent bullish candles, suggests that increasing buying interest could push PEPE up.
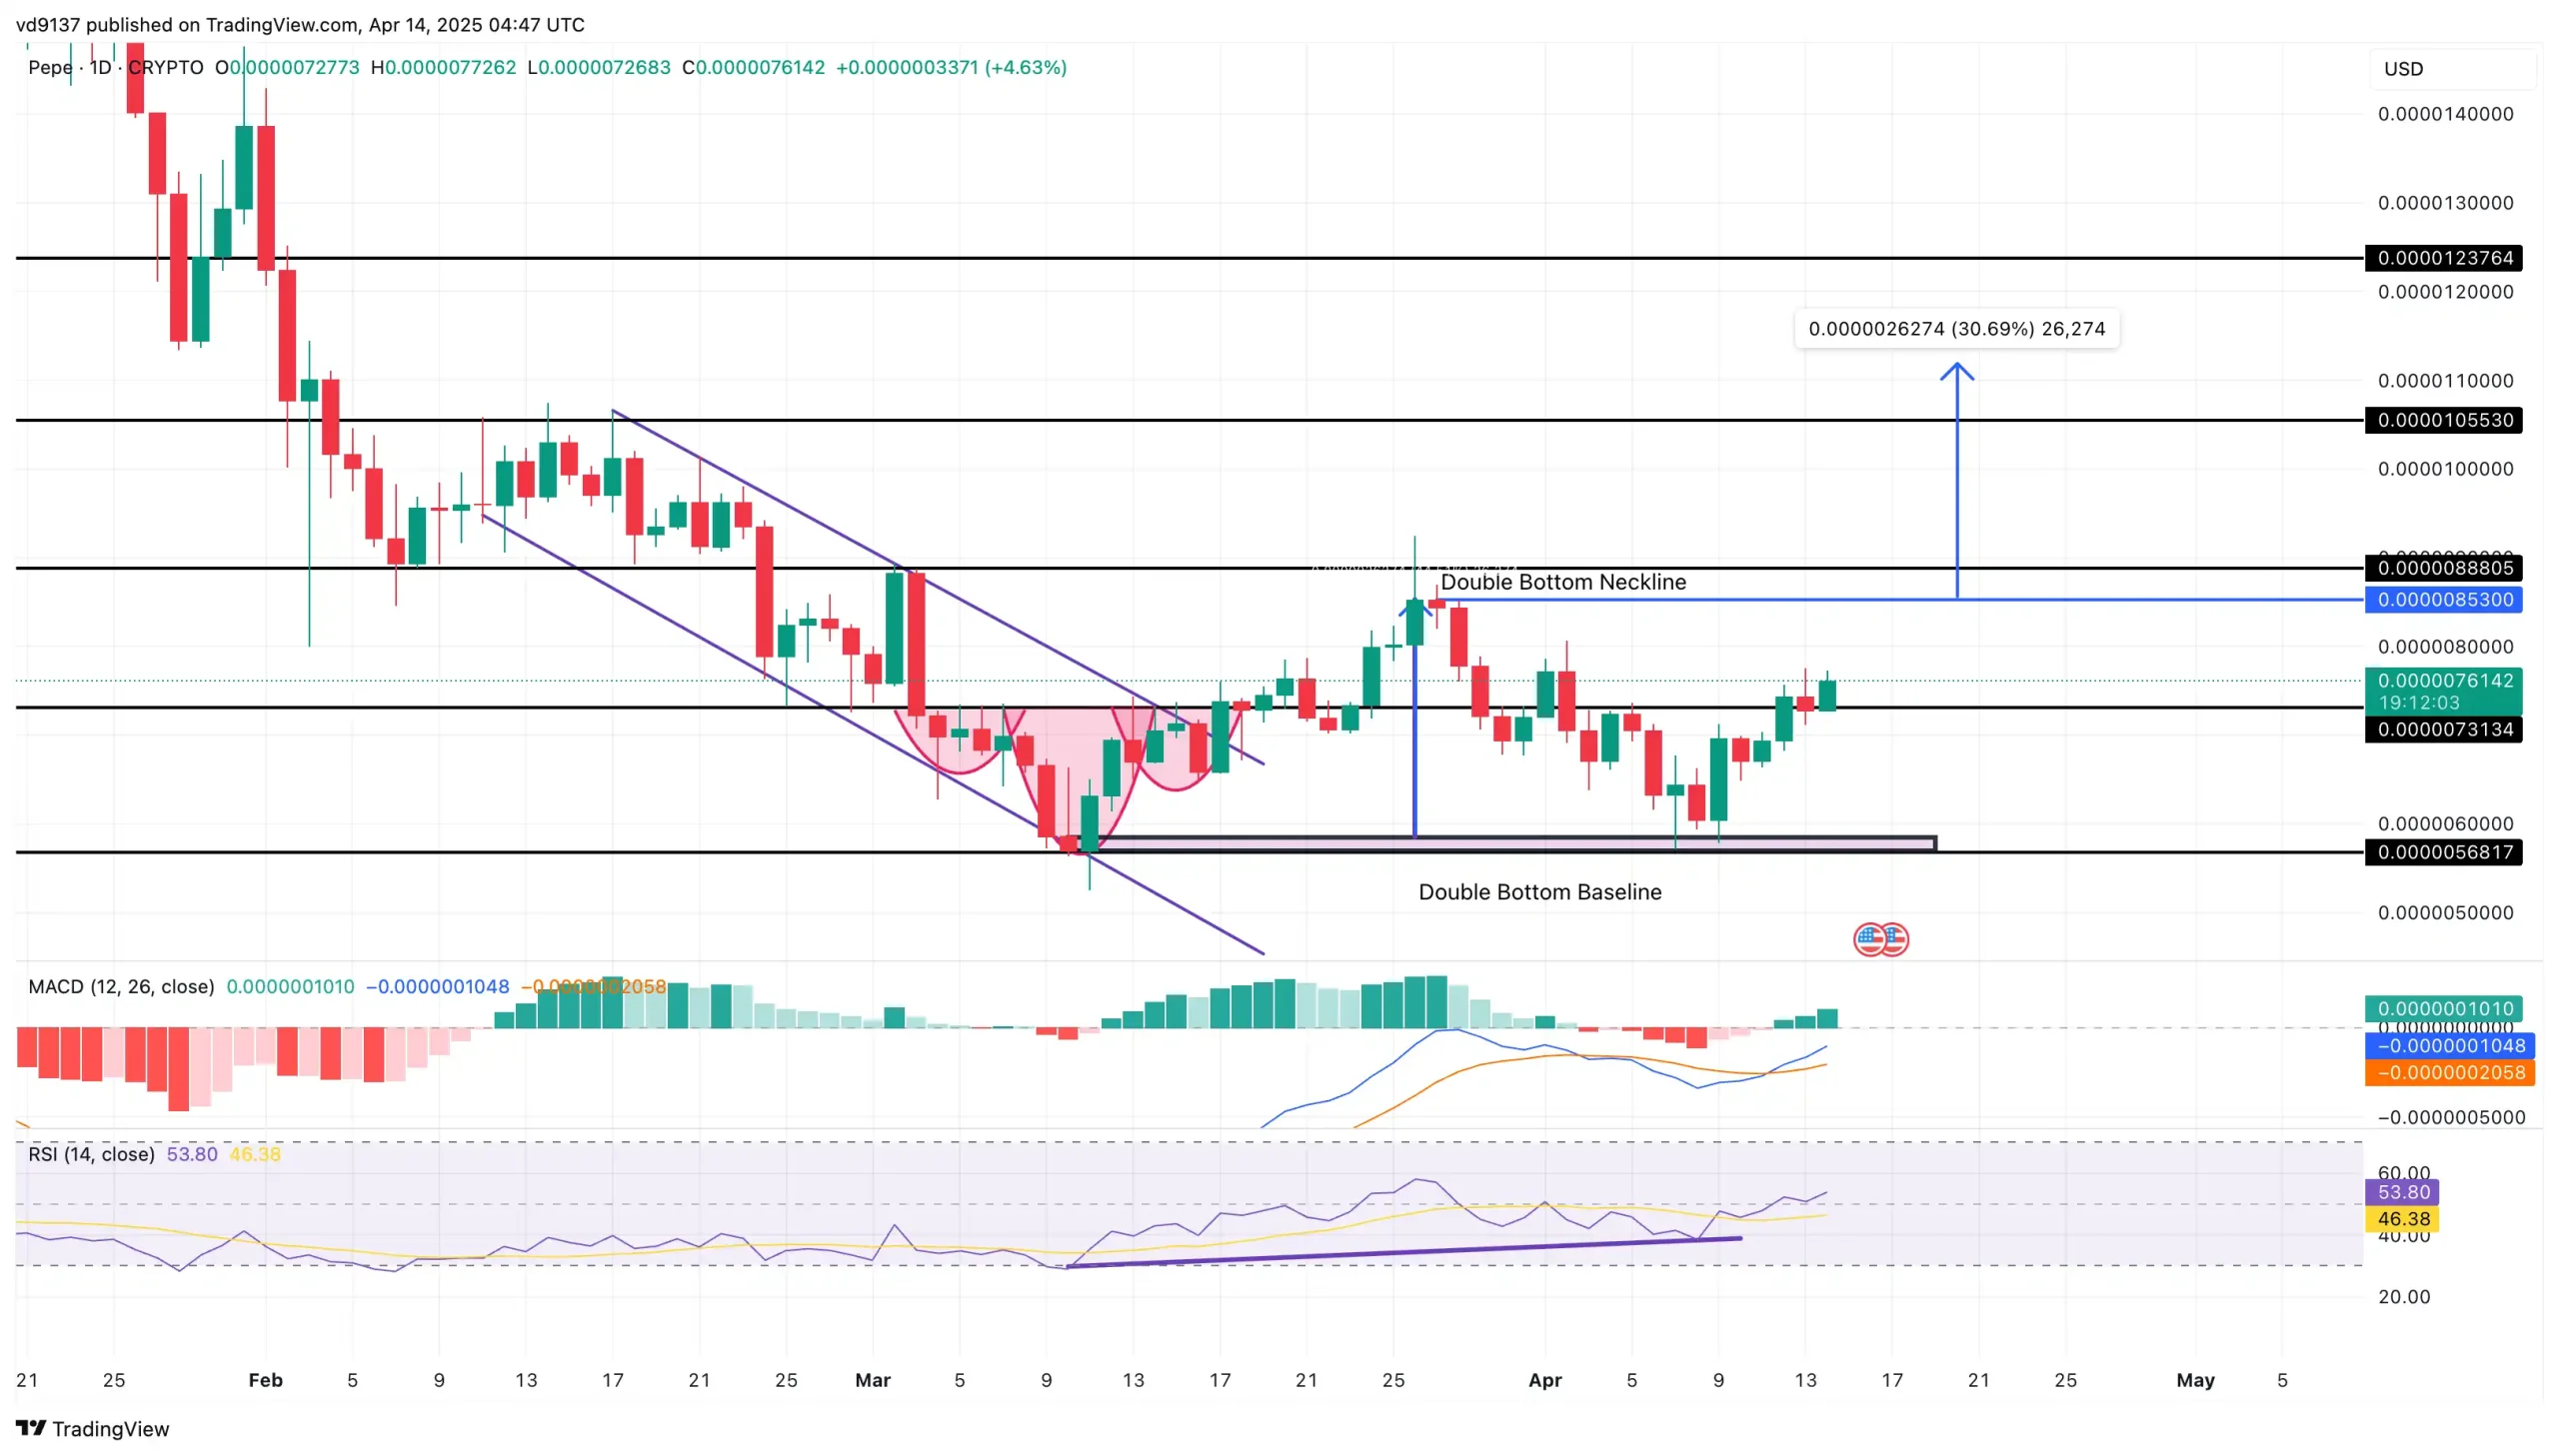
Based on Fibonacci retracement levels, a breakout above the neckline resistance could target the 38.2% retracement level around $0.00001055, followed by the 50% level at approximately $0.00001237. These levels align with previous support zones that have now become resistance.
The RSI reading of 53.80 indicates a transition from bearish dominance into neutral territory. This transition above level 50 suggests increasing bullish momentum, while the gradual rise of the RSI since March affirms the probability of sustained upside price recovery.
The MACD indicator shows a positive crossover with the MACD line surpasses the signal line. The histogram is filling up with bright green bars, which confirms strengthened buying pressure.
PEPE Price Targets
The important support for PEPE is held at $0.000005681 (the baseline of the double bottom) and $0.000007313 (recent consolidation low). Major resistances are $0.000008880 (double bottom neckline) and $0.00001055 (38.2% Fibonacci retracement level), and the psychological threshold of $0.000010.
If PEPE break the neckline resistance, the measured move target based on the double bottom pattern would predict movement up to $0.000012, a 58% rise from current levels. In the more bullish scenario with a broader market to support it, PEPE could even target a 61.8% Fibonacci level at close to $0.00001300.
On the downside, a break below $0.000005681 will see prices test certain yearly lows that will likely target around $0.00000050.
Buyers Takeover PEPE Derivatives Market
The PEPE Long/Short Ratio Chart shows a dynamic battle between long and short positions over time. As of April 14, long positions slightly dominate at 52.44%, while short positions stand at 47.56%, giving a Long/Short ratio of 1.1026.
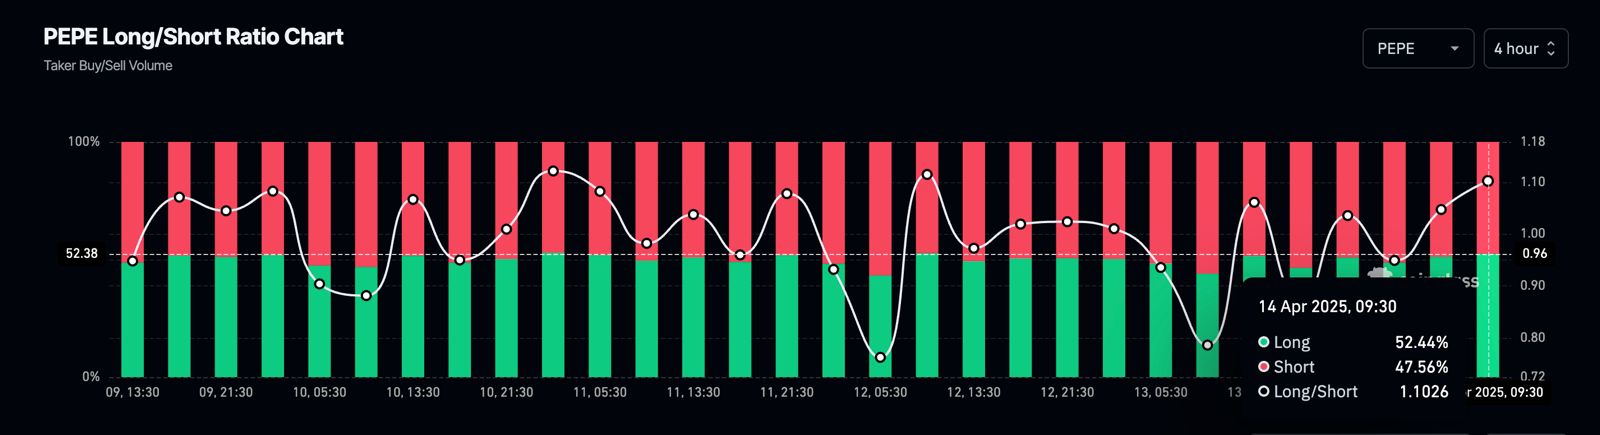
The chart reveals frequent shifts in sentiment, with buyers and sellers alternating control. The recent uptrend in the ratio suggests growing bullish sentiment among traders.