- Price has dropped down to $14.9.
- Chainlink price analysis shows downtrend.
- Support is still fixated at $12.388.
Chainlink-price-analysis-2021-01-27″>The bears have taken over the market once again as the bearish slide is continued. The latest drop in coin value has reduced it to the $14.87 level. The cryptocurrency value went down to the extreme in the past few weeks as a strong bearish wave took over the market. The trend continues, as a constant decreasing trend has been observed for the past 24-hours. The long-term trending line is traveling descendingly, yet again a bearish indication.
LINK/USD 1-day price chart: Cryptocurrency to tackle further loss as bears remain consistent
The one-day Chainlink price analysis shows negative changes in the price trends, as the bears have been controlling the market for the day. The market has been following a decreasing trend for the past few weeks, and the bearish current seems to be overpowering for the bulls this week as well. Today, the price underwent further reduction and moved down to a $14.87 low. If we discuss its moving average (MA) value, it is settling at $16.99.
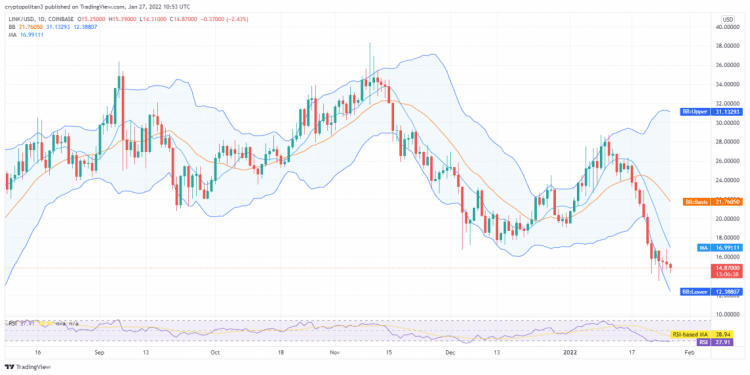
A crossover between the SMA 50 curve and the SMA 20 curve was observed in the prior weeks due to the massive price drop. As the volatility seems to be expanding, more fall in LINK/USD value is expected. The upper Bollinger band value has moved down to $31.132, whereas the lower Bollinger band value has moved to $12.388. The Relative Strength Index (RSI) score is now lower than the under-bought edge, i.e., 27.91.
Chainlink price analysis: Bulls to encounter bearish resistance as price slips to $14.87
The hourly price prediction for LINK/USD is also predicting a downtrend as the price followed a decreasing movement in the previous hours. Although the bulls tried to recover their position earlier, the price went low in four hours. The coin value is now at $14.870 as the bears took charge once again. The short-term trending line is also indicative of an ongoing bearish trend. The moving average is comparatively going high, i.e., $15.44.
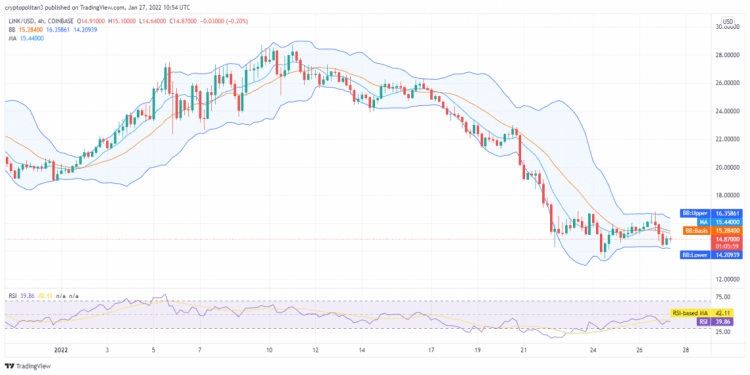
The volatility is decreasing, which means that there is a high chance that an uptrend is on its way. The upper band of the Bollinger bands Indicator is now touching $16.36, whereas the lower band is at $14.209. The RSI graph shows a downward curve, and the score is now standing at 39.86.
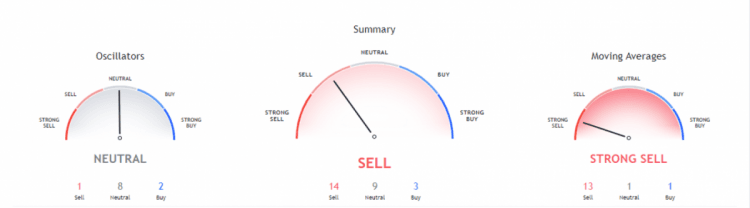
The market trends have constantly fluctuated, but the bears have been dominating over the past two weeks. This is being further confirmed by the technical indicators chart, which gives out a selling signal. There are 14 indicators on the selling position; nine are neutral, whereas only three are on the buying position.
The Moving Averages Indicator is also giving out a strong bearish signal for the sellers. We can see that a total of 13 indicators are on the selling side, while one indicator each sits on the neutral and buying sides. The Oscillators give a neutral hint regarding the current market scenario. Eight indicators stand on the neutral point; two indicators stand on the buying and only one indicator stans on the selling point.
Chainlink price analysis conclusion
The following one-day and four-hour Chainlink price analysis confirms an ongoing downswing. The bears have successfully lowered the LINK/USD value down to $14.87 extreme during the day. Further devaluation in cryptocurrency value seems to be near as the downtrend intensifies each day.
Disclaimer. The information provided is not trading advice. Cryptopolitan.com holds no liability for any investments made based on the information provided on this page. We strongly recommend independent research and/or consultation with a qualified professional before making any investment decisions.