On April 9, 2025, XRP’s valuation rests at $2.07, a figure that mirrors vigorous trading dynamics with a 24-hour turnover of $8.12 billion and a total market cap of $121 billion. The intraday oscillation spanned from $1.73 to $2.086, illustrating pronounced fluctuations throughout the session.
XRP
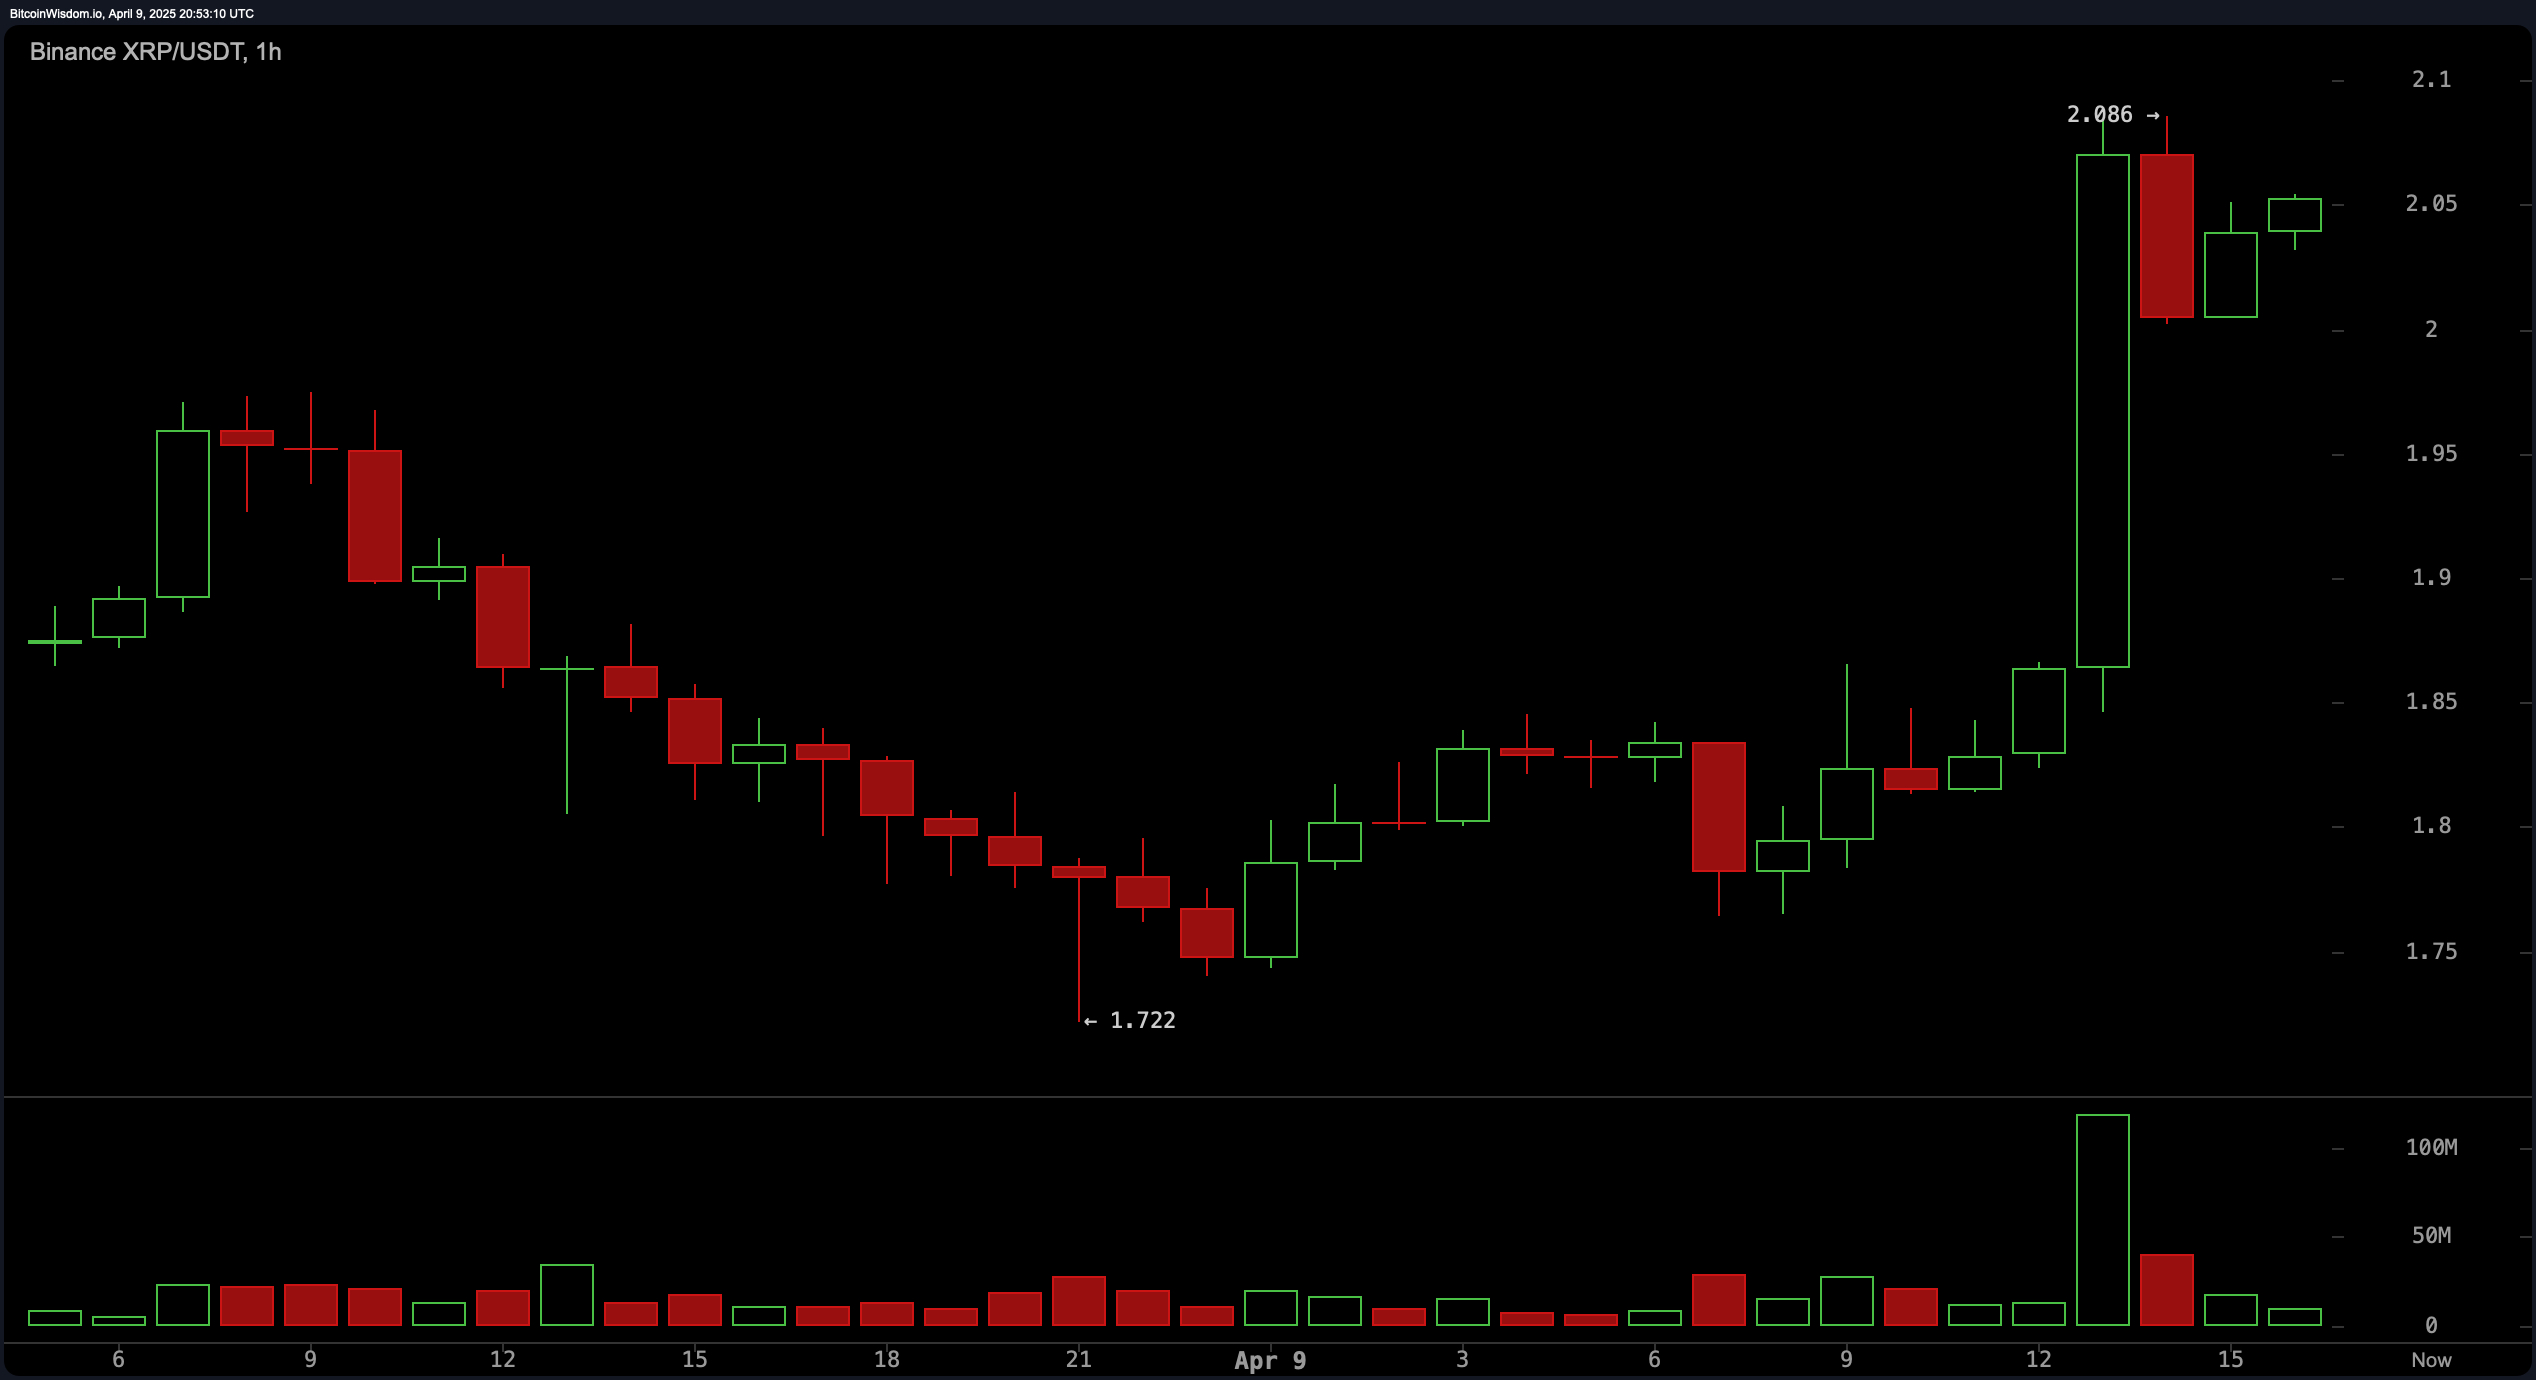
Turning to the 1-hour chart, XRP exhibited a powerful impulsive rally followed by a period of consolidation, implying a temporary halt after a substantial upward thrust. A breach above the $1.85 threshold toward $2.086 was bolstered by an evident escalation in trading activity, signaling intense buying pressure during that pivotal phase. The range between $2.00 and $2.05 has now emerged as a focal point, with traders treating it as short-term footing. Those pursuing intraday strategies may view this zone as a foundation for bullish continuation patterns, especially if XRP constructs a flag or revisits this area on subdued volume. Upside barriers are identified near $2.15 to $2.20, offering a logical take-profit objective for short-term trades.
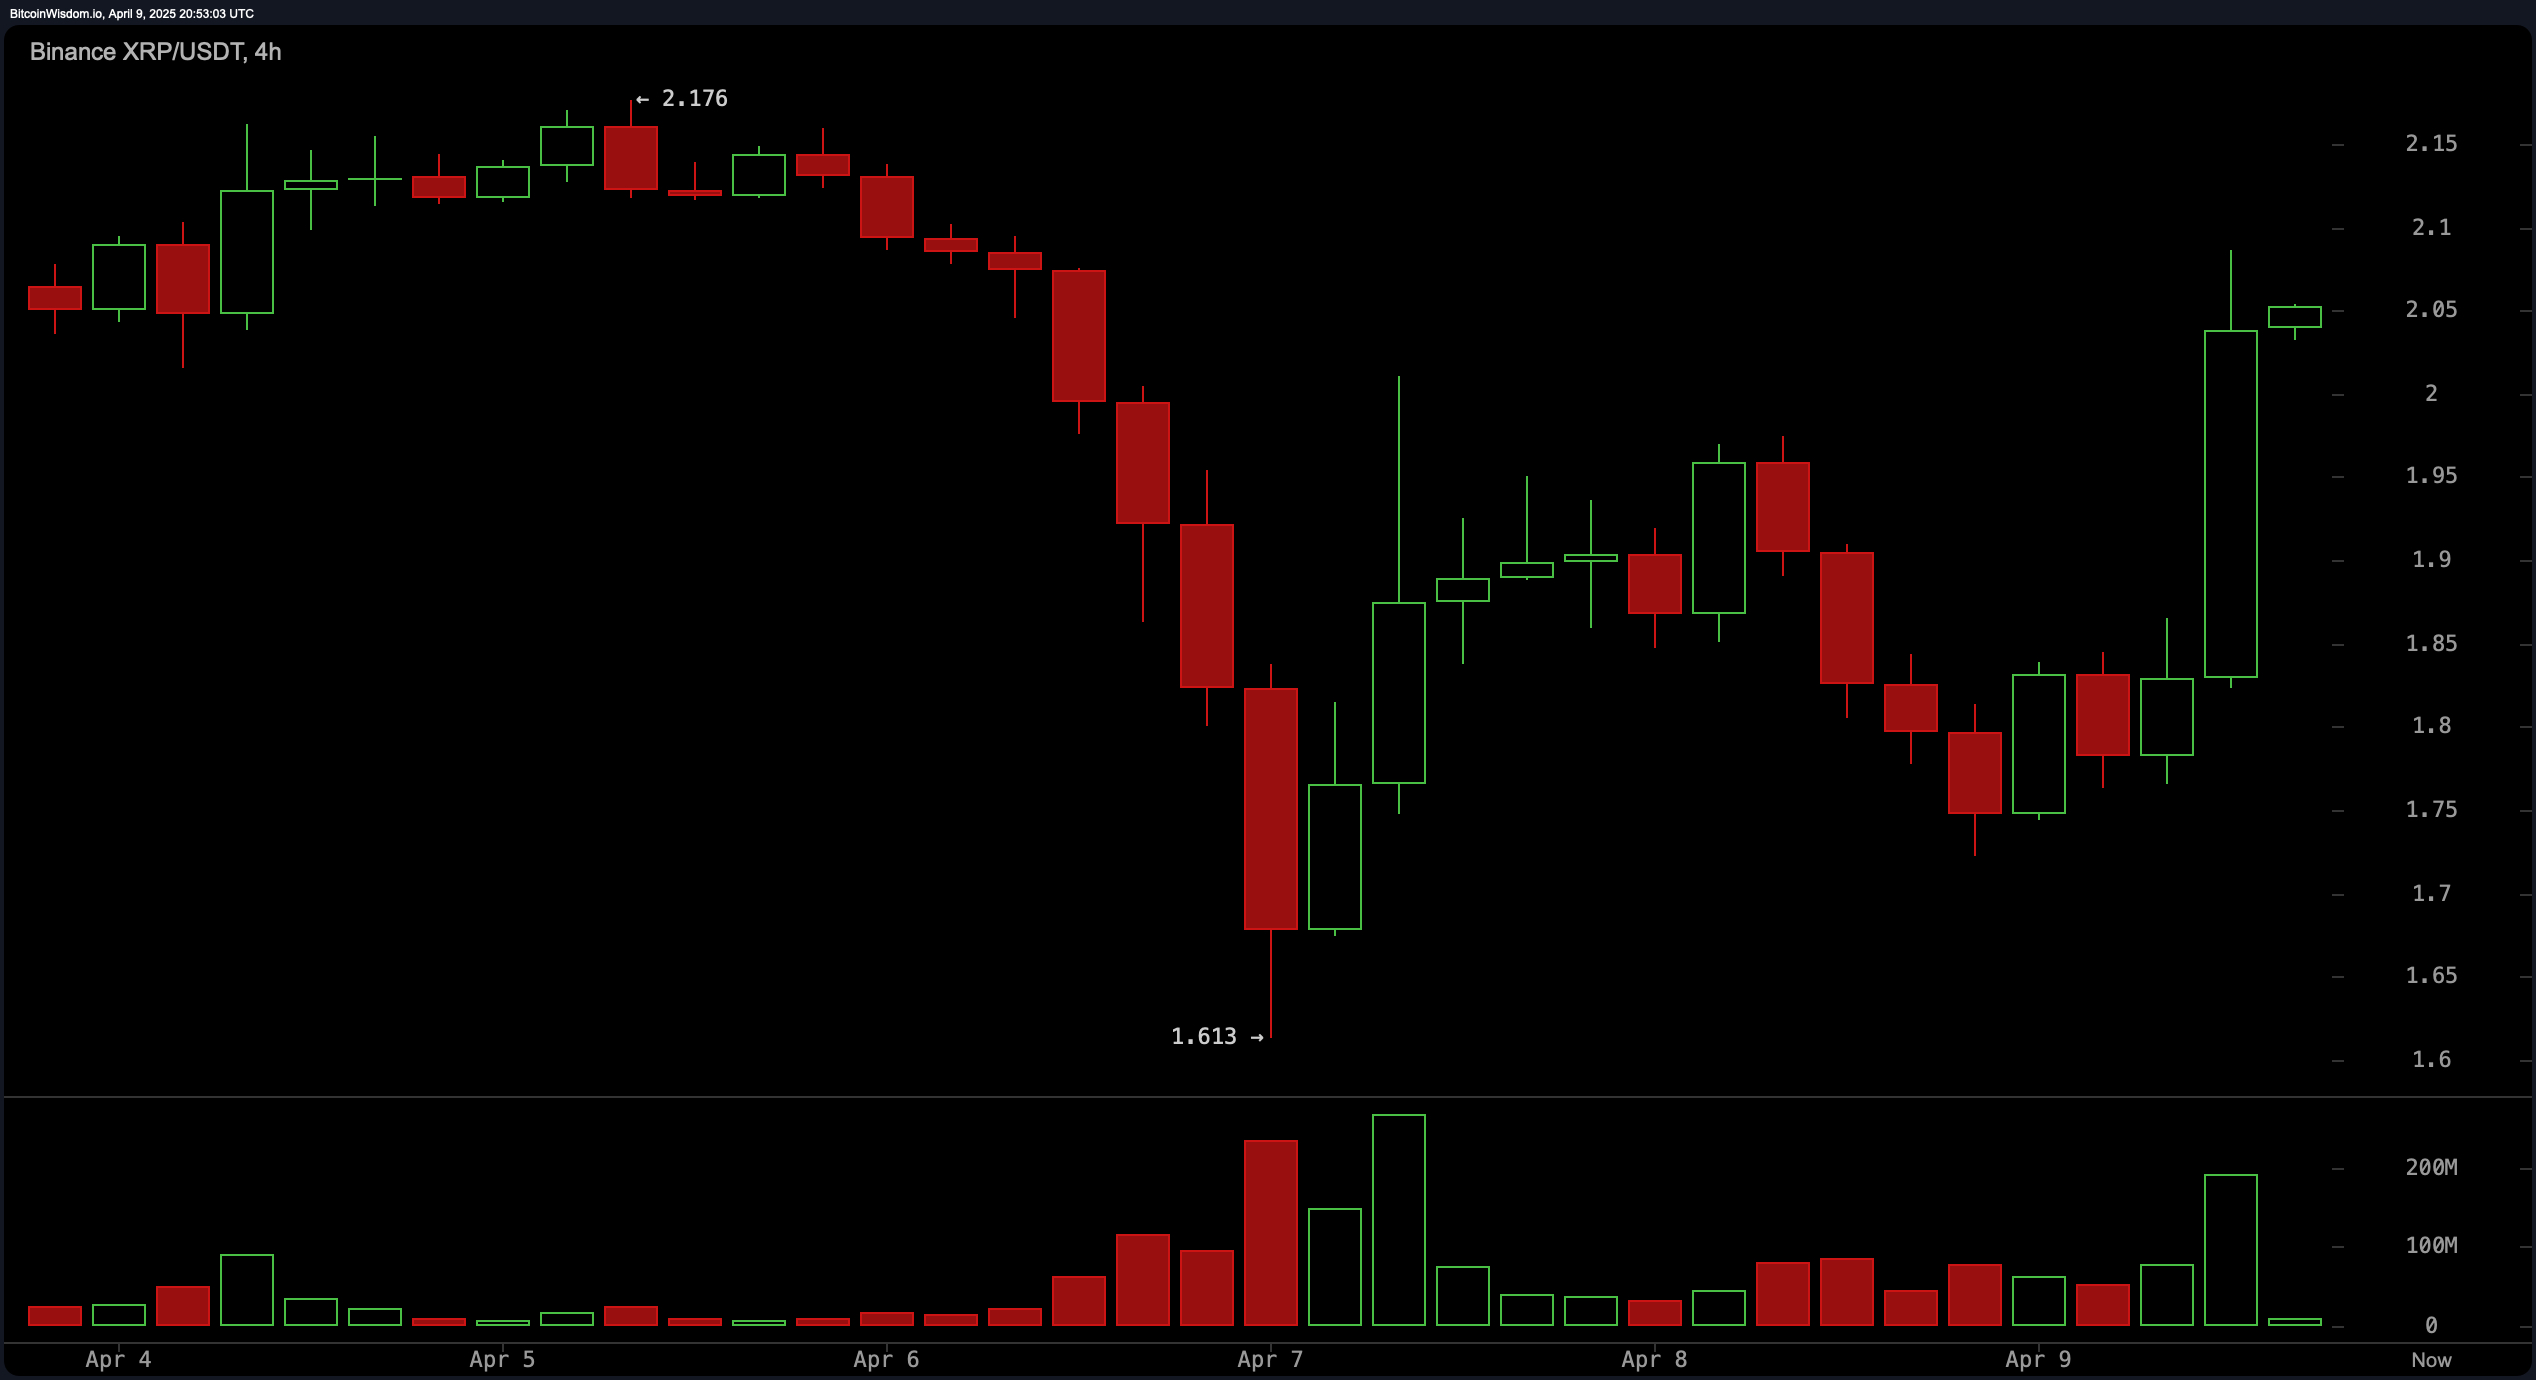
The 4-hour chart corroborates a broader rebound, recovering sharply from the $1.61 trough to levels surpassing $2.05. This resurgence is reinforced by successive green candlesticks and significant volume inflows, suggesting a positive shift in medium-term sentiment. Resistance around $2.18, marked by recurring upper wick rejections, remains a decisive challenge for buyers. A decisive breach and sustained closure above the $2.05 to $2.10 band could facilitate a progression into the $2.20 region. On the downside, support lies near $1.95, presenting a prudent stop-loss zone for position traders monitoring this timeframe.
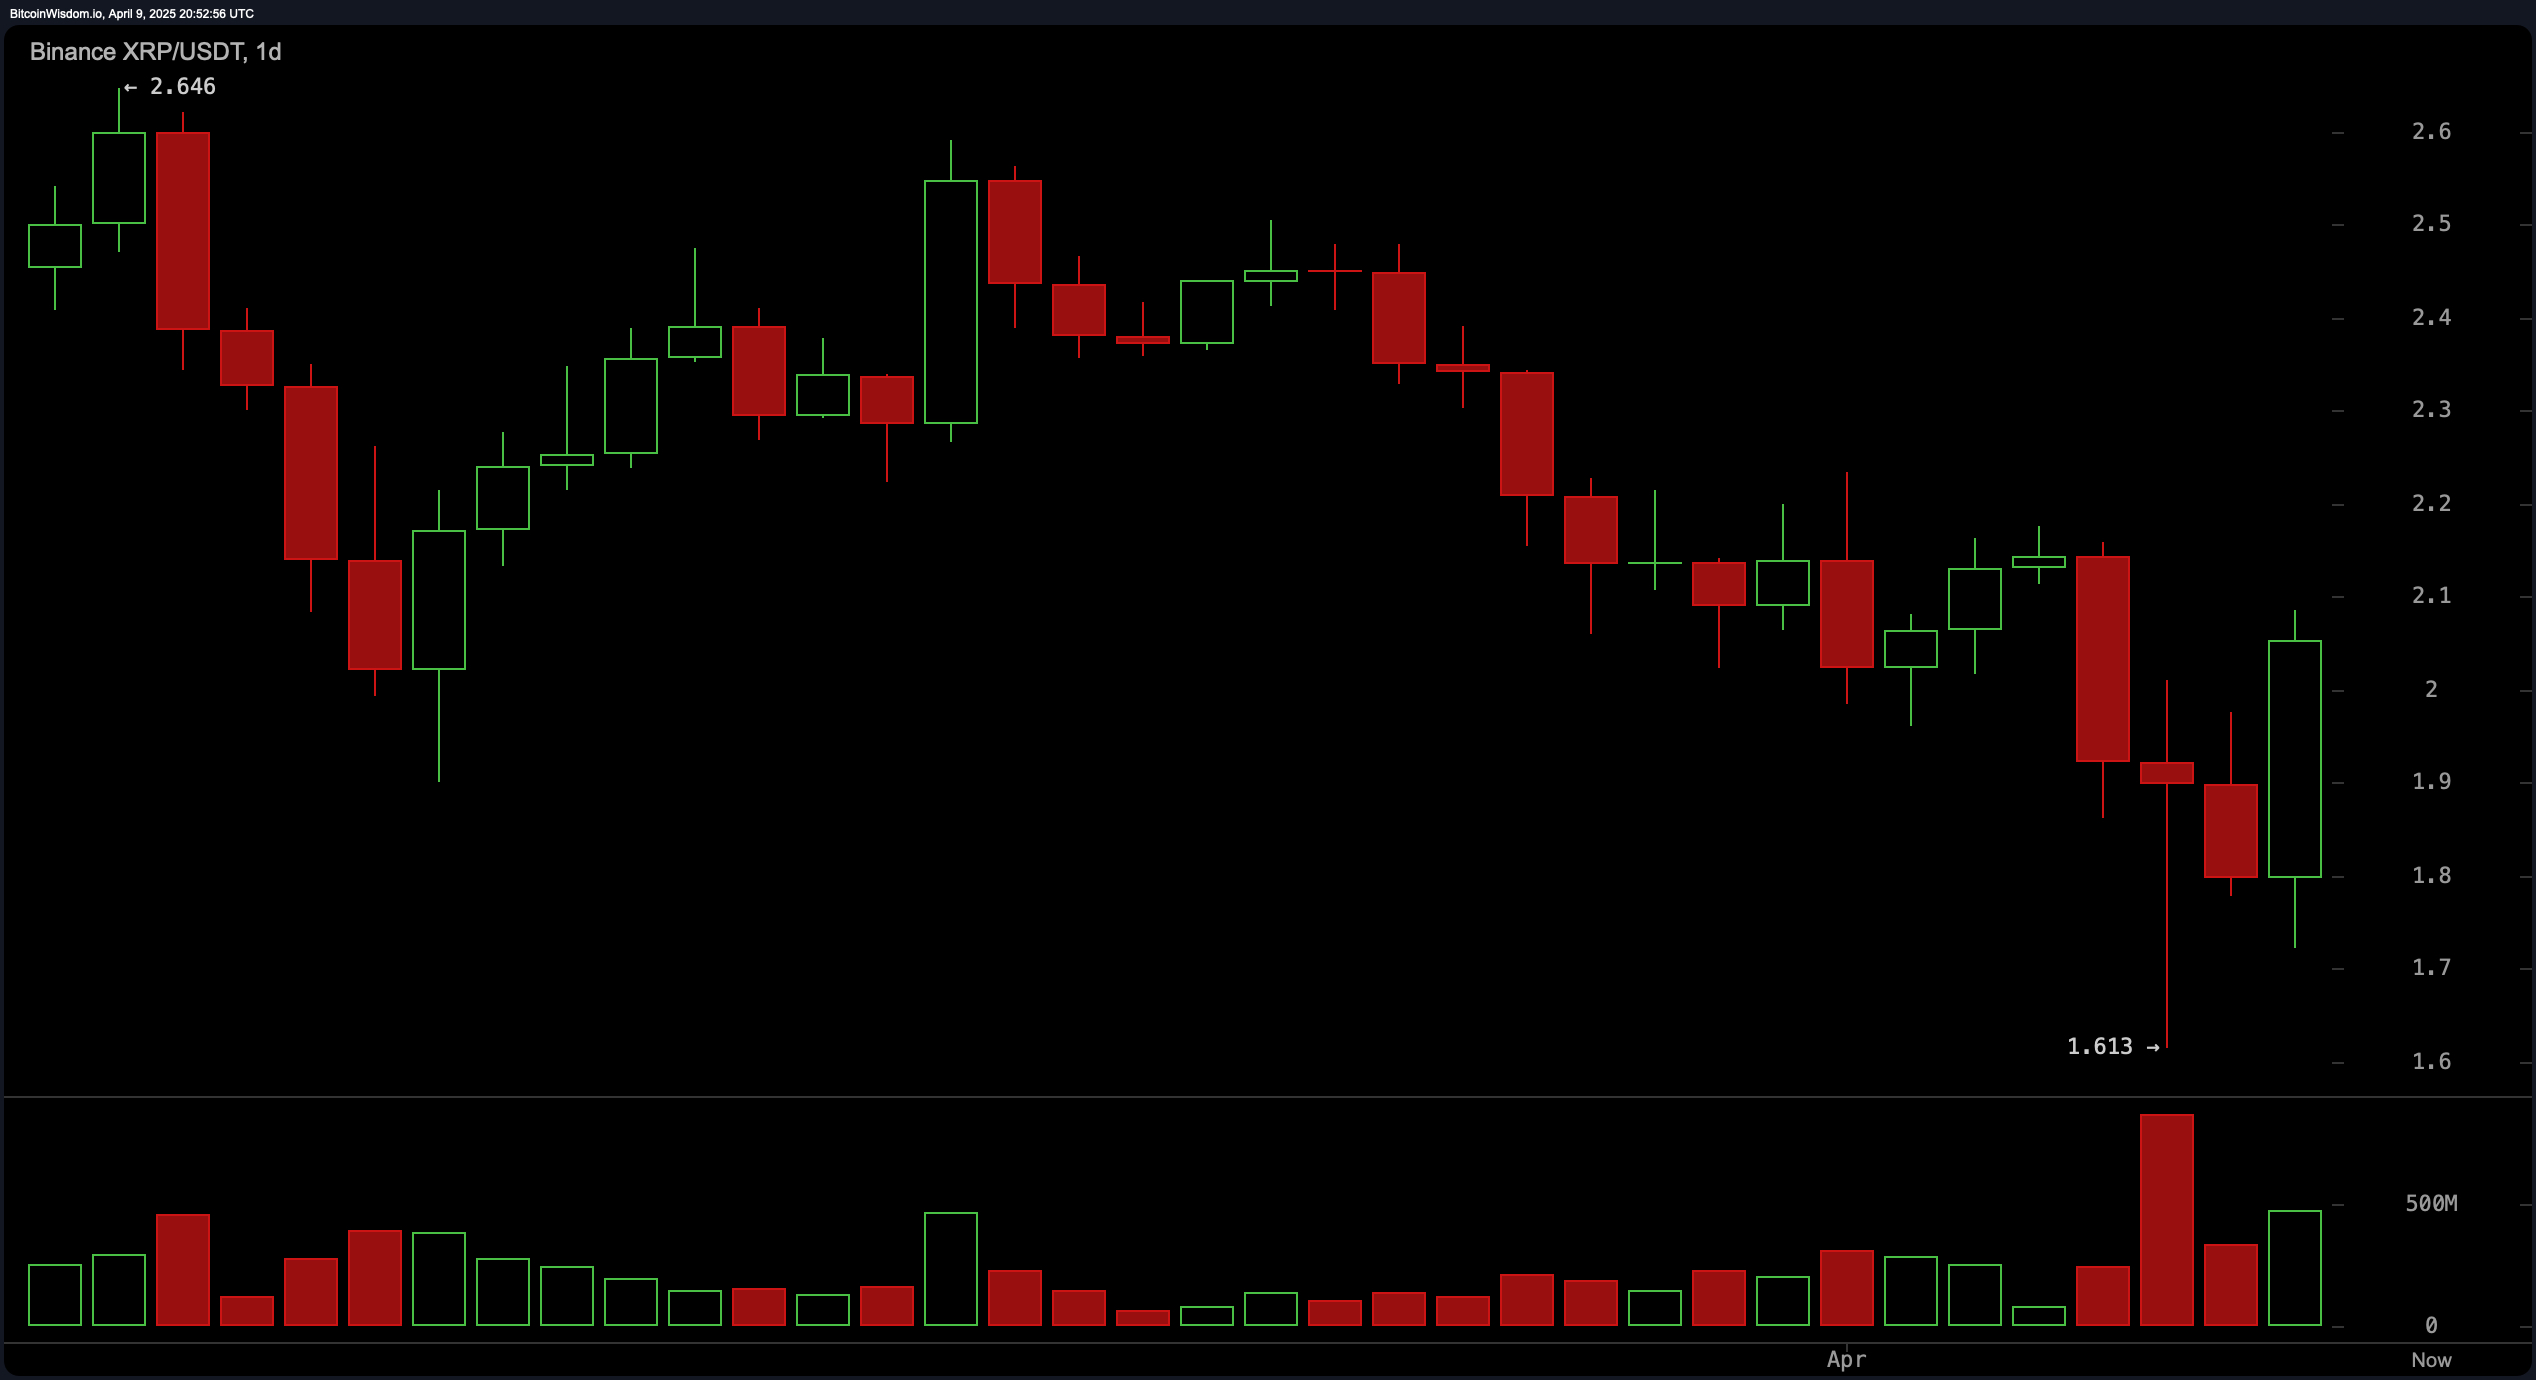
On the daily chart, XRP has demonstrated a compelling bullish reversal following an extended downturn, highlighted by a robust green candle and amplified trading volume. The recovery from the $1.61 low hints at a blend of short-covering and renewed buying enthusiasm, potentially heralding a lasting trend change. Resistance is anticipated between $2.10 and $2.20, while a close beyond this span would further authenticate bullish continuation prospects. Price objectives in the event of sustained progress could extend into the $2.45 to $2.60 territory, aligning with prior resistance clusters. Conversely, an inability to maintain levels above $2.00 might spark concerns of a deceptive rally, particularly if accompanied by dwindling volume.
Oscillator metrics currently lean toward neutrality, pointing to a phase of consolidation rather than a definitive momentum surge. The relative strength index (RSI) sits at 44.98, nestled within a neutral range that avoids both overbought and oversold extremes. The Stochastic at 36.68, the commodity channel index (CCI) at −91.57, the average directional index (ADX) at 23.34, and the awesome oscillator at −0.28 collectively suggest ambivalent momentum. The momentum (10) indicator is the lone bullish cue, registering at −0.086 and triggering a buy signal. However, the moving average convergence divergence (MACD) level at −0.113 issues a bearish alert, reflecting longer-term uncertainty despite fleeting strength.
Moving averages (MAs) project a mixed technical outlook. The exponential moving average (EMA) and simple moving average (SMA) for 10 days signal buy opportunities at $2.027 and $2.024, respectively, showcasing recent price vigor. Yet all subsequent moving averages, spanning 20-day to 100-day intervals, indicate negative signals, implying that XRP remains entrenched in a prolonged downtrend from a historical standpoint. Notably, the 200-day EMA at $1.948 and the 200-day SMA at $1.859 issue bullish sentiment, suggesting the price has reclaimed stability above long-term trend markers. This contrast between short-term optimism and mid-term skepticism accentuates the necessity of confirmation levels, such as a daily closure above $2.10, to ascertain XRP’s forthcoming trajectory.
Bull Verdict:
If XRP sustains a daily close above the $2.15 resistance level with continued volume support, it could confirm a bullish reversal, propelling the price toward the $2.45–$2.60 range. The confluence of short-term buying signals, a V-shaped recovery, and strong long-term moving average support highlights the potential for renewed upward momentum.
Bear Verdict:
Should XRP fail to break and hold above $2.15, particularly amid declining volume or repeated rejections at $2.20, the current move may be a short squeeze or bull trap. The predominance of negative signals across mid-term moving averages and neutral oscillators could point to a potential retest of the $1.95–$1.73 support zone.