
- Bitcoin price hovers around $78,600 on Monday after falling nearly 5% the previous week.
- Ethereum price fails to find support around key levels and reaches levels not seen since 2023.
- XRP breaks below its support level at $1.96, targeting its yearly low.
Bitcoin (BTC) price hovers around $78,600 on Monday after falling nearly 5% the previous week. Ethereum (ETH) and Ripple (XRP) also followed in BTC’s footsteps and declined 13% and 10%, respectively, in the previous week. Bears remain strong as ETH reaches levels not seen since 2023 while BTC and XRP target their yearly lows.
Bitcoin bears aim for its yearly low of $76,606
Bitcoin’s price declined by almost 5% last week after being rejected from its key level of $85,000. On Sunday,it found support around $78,258. At the time of writing on Monday, it is hovering around that support level.
If BTC breaks and closes below $78,258, it could extend the decline to retest its yearly low of $76,606 ( March 11 low). A successful close below would extend an additional decline to test the next daily support level at $73,072.
The Relative Strength Index on the daily chart reads 37, below its neutral level of 50, indicating strong bearish momentum. The Moving Average Convergence Divergence (MACD) indicator also shows a bearish crossover on Sunday, giving sell signals and suggesting a downward trend.
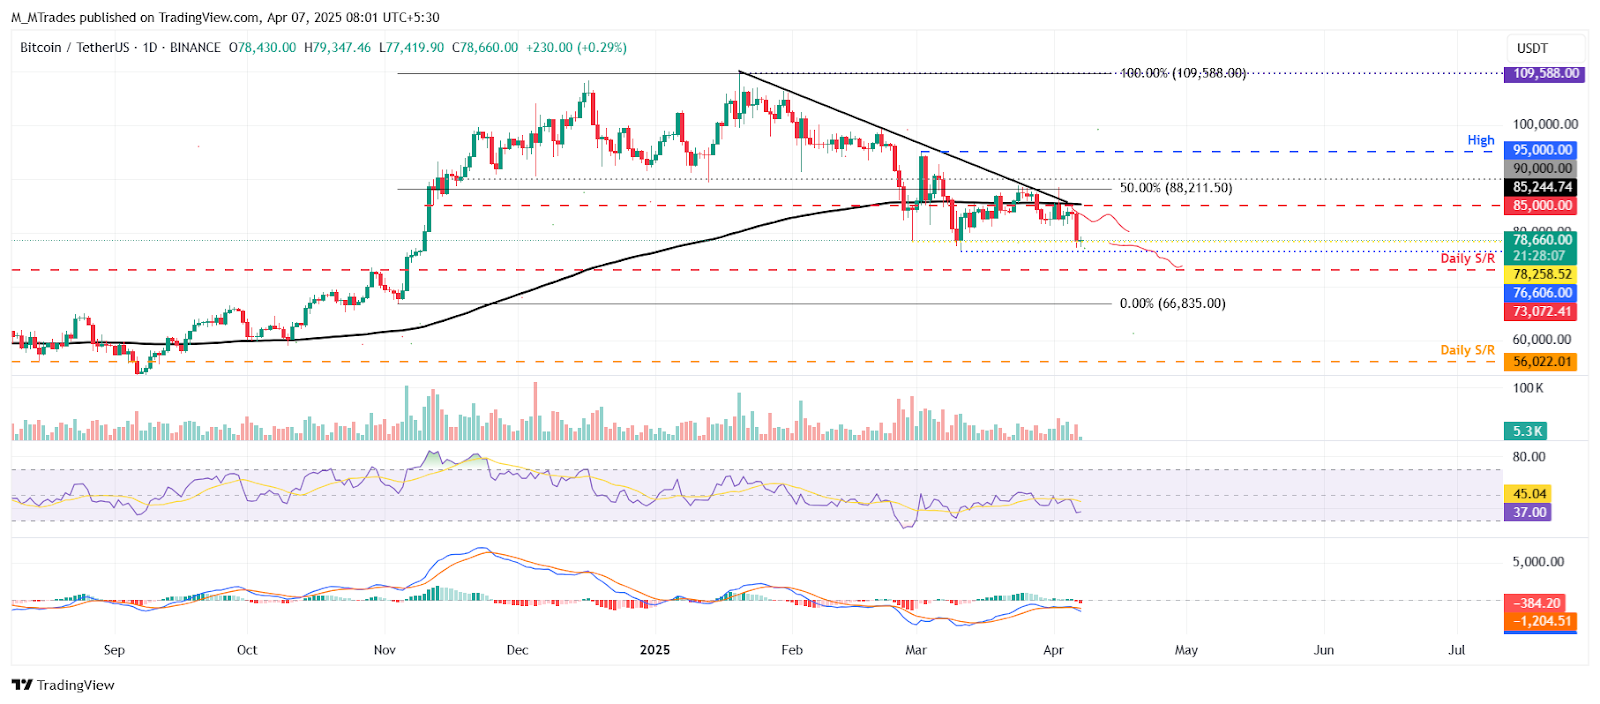
BTC/USDT daily chart
However, if BTC finds support around the $78,258 level, it could extend the recovery to retest its daily resistance at $85,000.
Ethereum reaches levels not seen since October 2023
Ethereum price declined nearly 13% last week after failing to close above the daily level of $1,861. Moreover, on Sunday,it corrected to retest its important psychological level of $1,700, which it has not seen since October 2023. At the time of writing on Monday, it hovers around $1,575.
If ETH continues its downward spiral, it could extend the decline to retest its next daily support at $1,449.
The RSI reads at 27, below its oversold level of 30, indicating that Ethereum may be undervalued and could be due for a price recovery to the upside. However, the RSI could remain below the oversold level and continue its downward spiral. The MACD indicator also shows a bearish crossover on Sunday, giving sell signals and suggesting a downward trend.
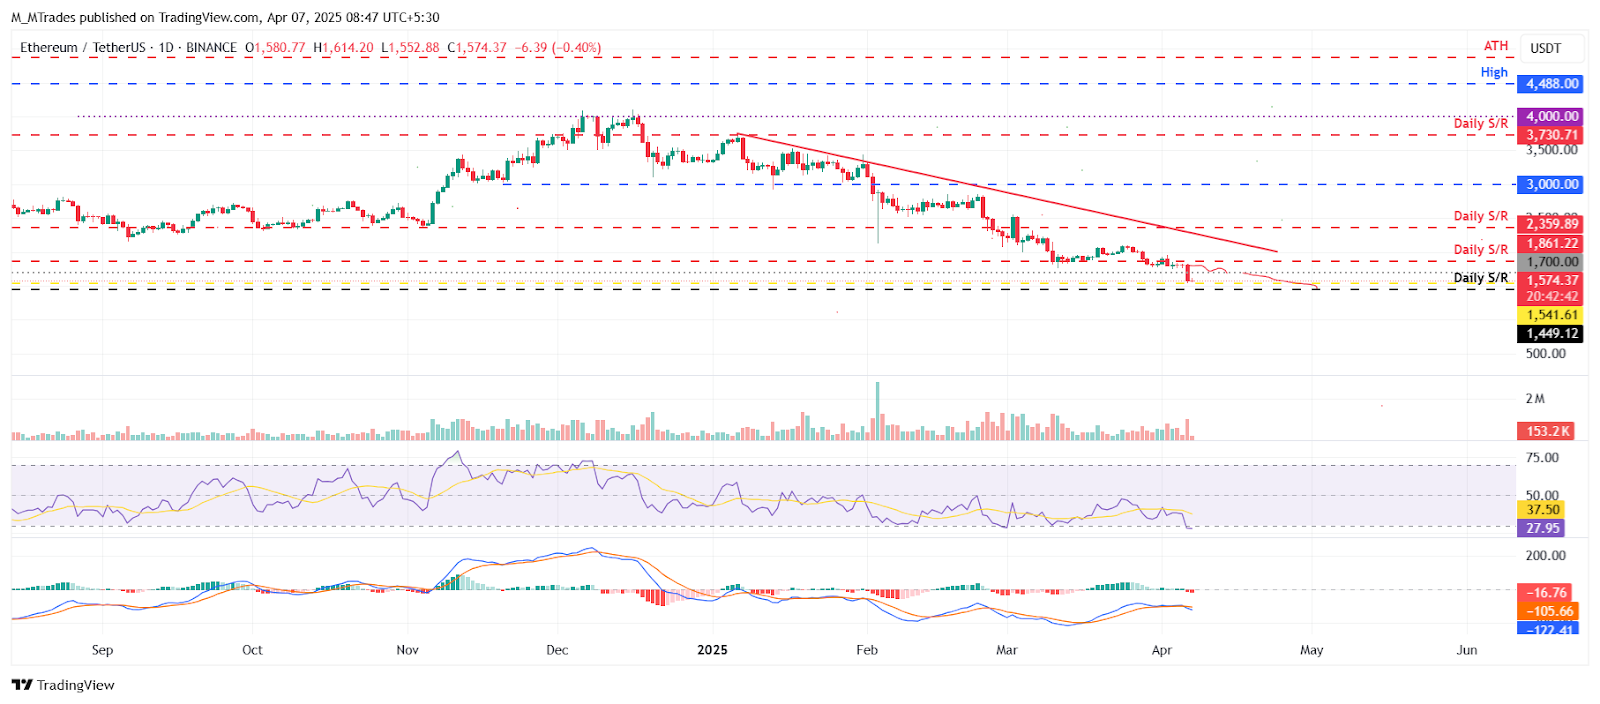
ETH/USDT daily chart
Conversely, if ETH recovers, it could extend the recovery to retest its important psychological level of $1,700.
XRP bears targeting yearly low as it closes below $1.96 support
XRP's price declined 10% the previous week and closed below its 200-day Exponential Moving Average (EMA) at $1.94, with its daily support level of $1.96 on Sunday. At the time of writing on Monday, it continues to trade down around $1.86.
If XRP continues its downward trend, it could extend the decline to test its February 3 daily low of $1.77, which is also the lowest level this year.
The RSI on the daily chart reads 33, below its neutral level of 50, like Bitcoin, indicating strong bearish momentum.
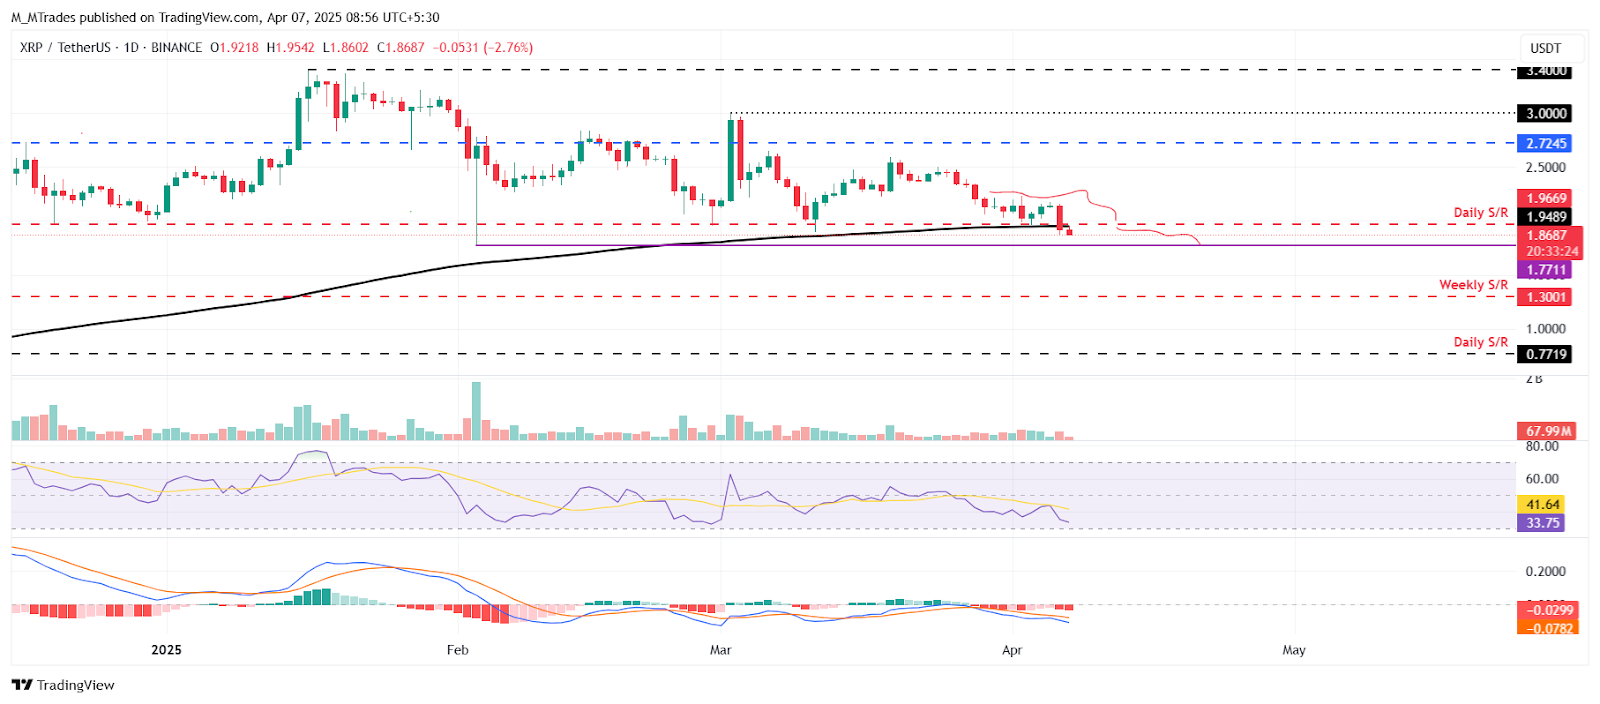
XRP/USDT daily chart
On the other hand, if XRP recovers, it could extend the recovery to test its daily level at $1.96.