On-Chain Indicators Highlight Exchange Outflows
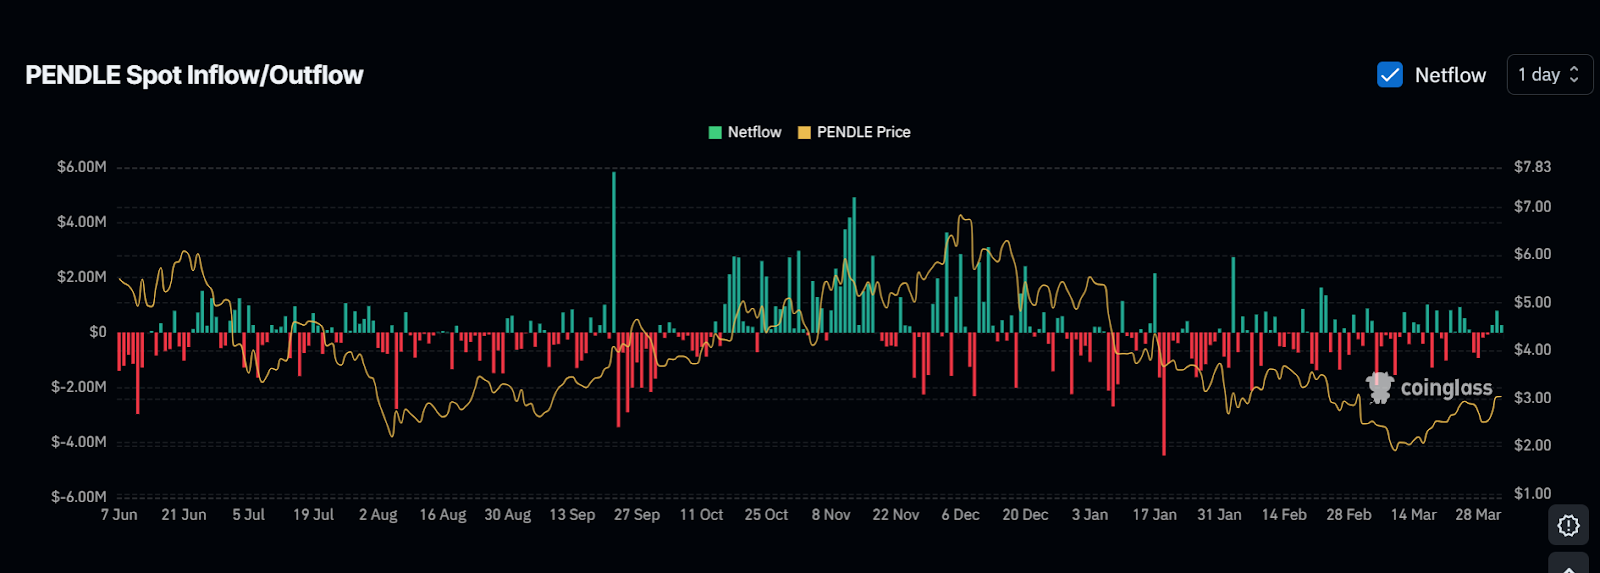
Supporting the withdrawal activity, the netflow data from Coinglass shows that $PENDLE has continuously been experiencing outflow, especially in late March and early April. Specifically, the figure reveals multiple days of net outflows greater than 1 million, which correlates with the movement of these whales.
$PENDLE Across Five New Wallets 1">
Source:Coinglass
This is in contrast to previous years, where both flows and outflows were almost equal. The latest shift in the flow of exchanges may be due to the large parties withdrawing their funds from centralized platforms or a shift towards longer-term investments.
Technical Indicators Reflect Positive Momentum for $PENDLE
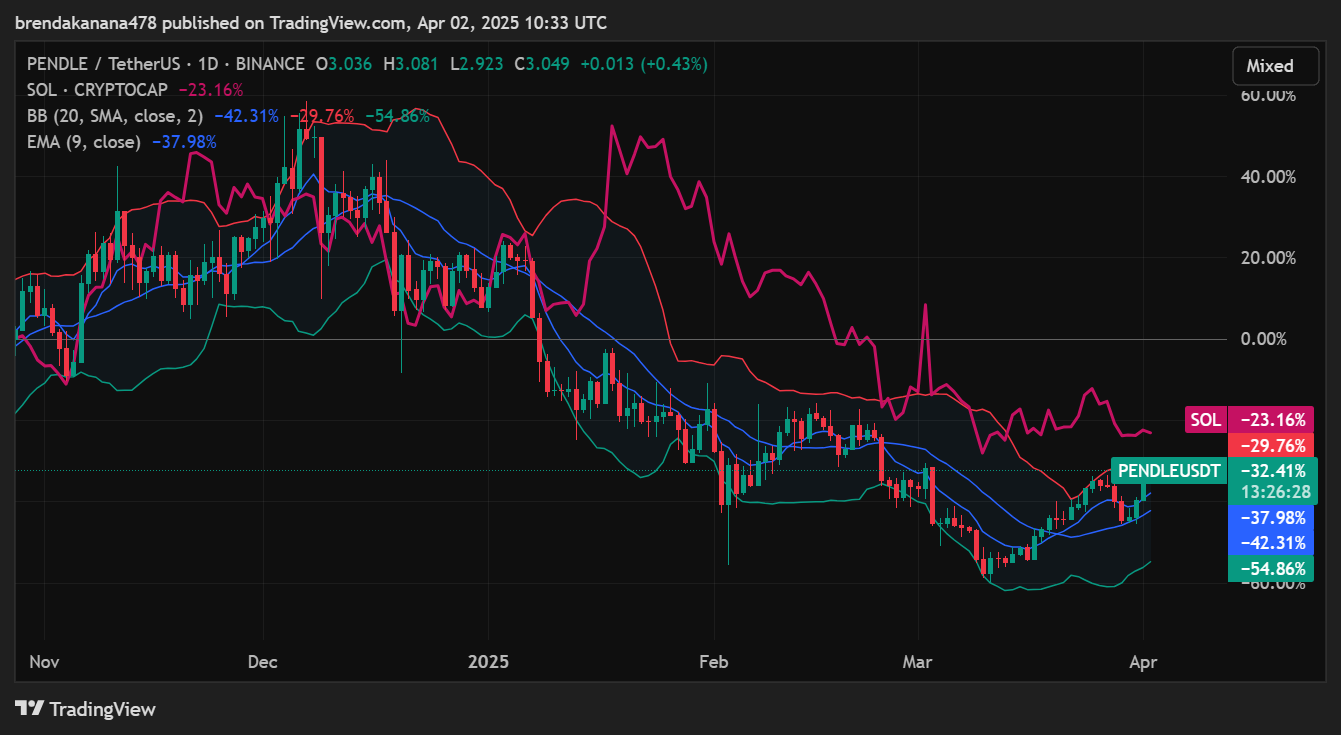
The increased whale movement demonstrated its stability and favourable price trend of $3.05, with a 6.61% increase within the last 24 hours. On the technical front, too, the signal remains bullish for the token.
According to the Bollinger Bands, it is evident that the price of $PENDLE is near the upper band, which signifies that there is a high probability of high volatility. Similarly, the 9-day Exponential Moving Average (EMA) is upward, indicating recovery with a -37.98% deviation from the prior correction.
$PENDLE Across Five New Wallets 2">
Source:Trading view
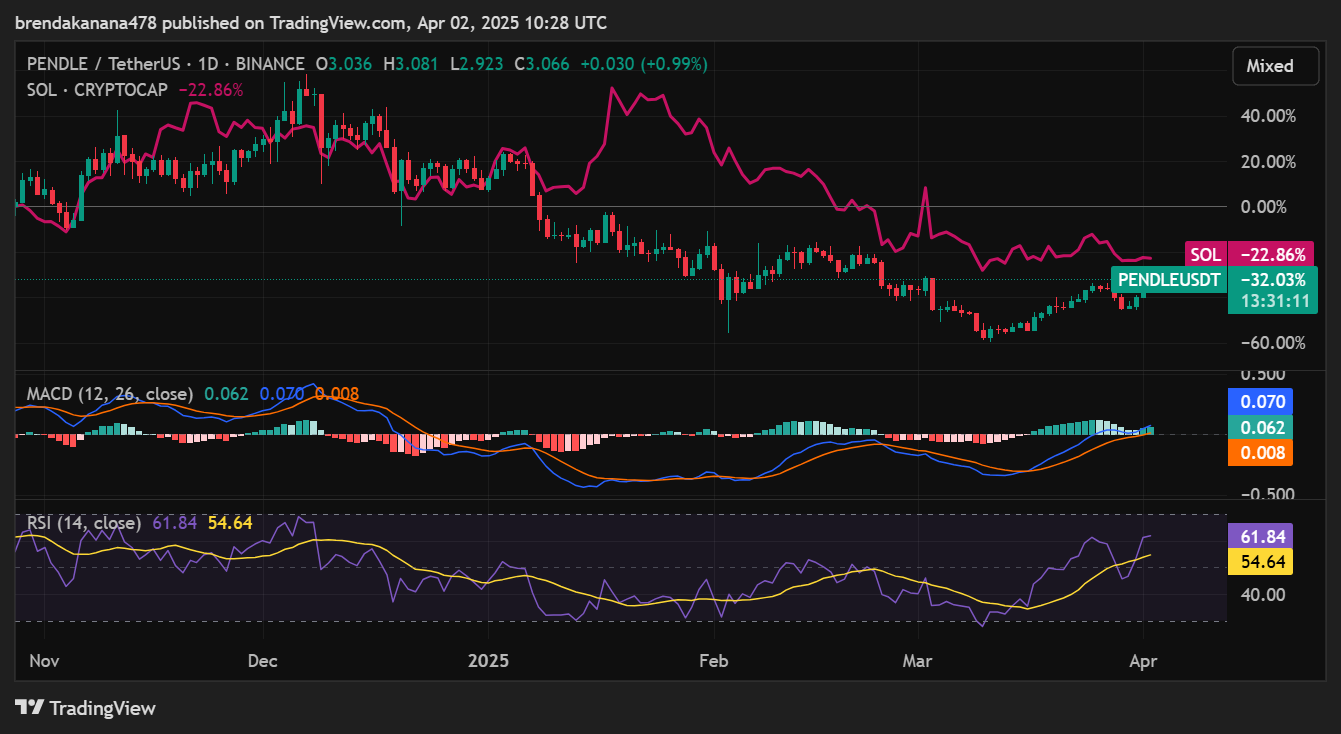
The RSI is currently at 61.84 suggesting that buying pressure has persisted among the public. However, if the RSI gets closer to the overbought level, there might occur the short-term range if the upward impulse weakens.
$PENDLE Across Five New Wallets 3">
Source:Trading view
The MACD also indicates the bullish trend by having a MACD of 0.062 and a signal line of 0.008. This means that the trend for the price may still go high. Parallel to whale movements, $PENDLE has increased its daily trading volume by 14.53% and is now equal to $106.25 million. This increased trading volume suggests greater investor interest, coupled with increased accumulation by whales and technically derived trends.
If the bulls are sustained, the $PENDLE price may reach the $3.20 resistance level. Support remains at $2.85, and the breakout above the upper Bollinger Bands would endorse the bullish predictions.

 blockchainreporter.net