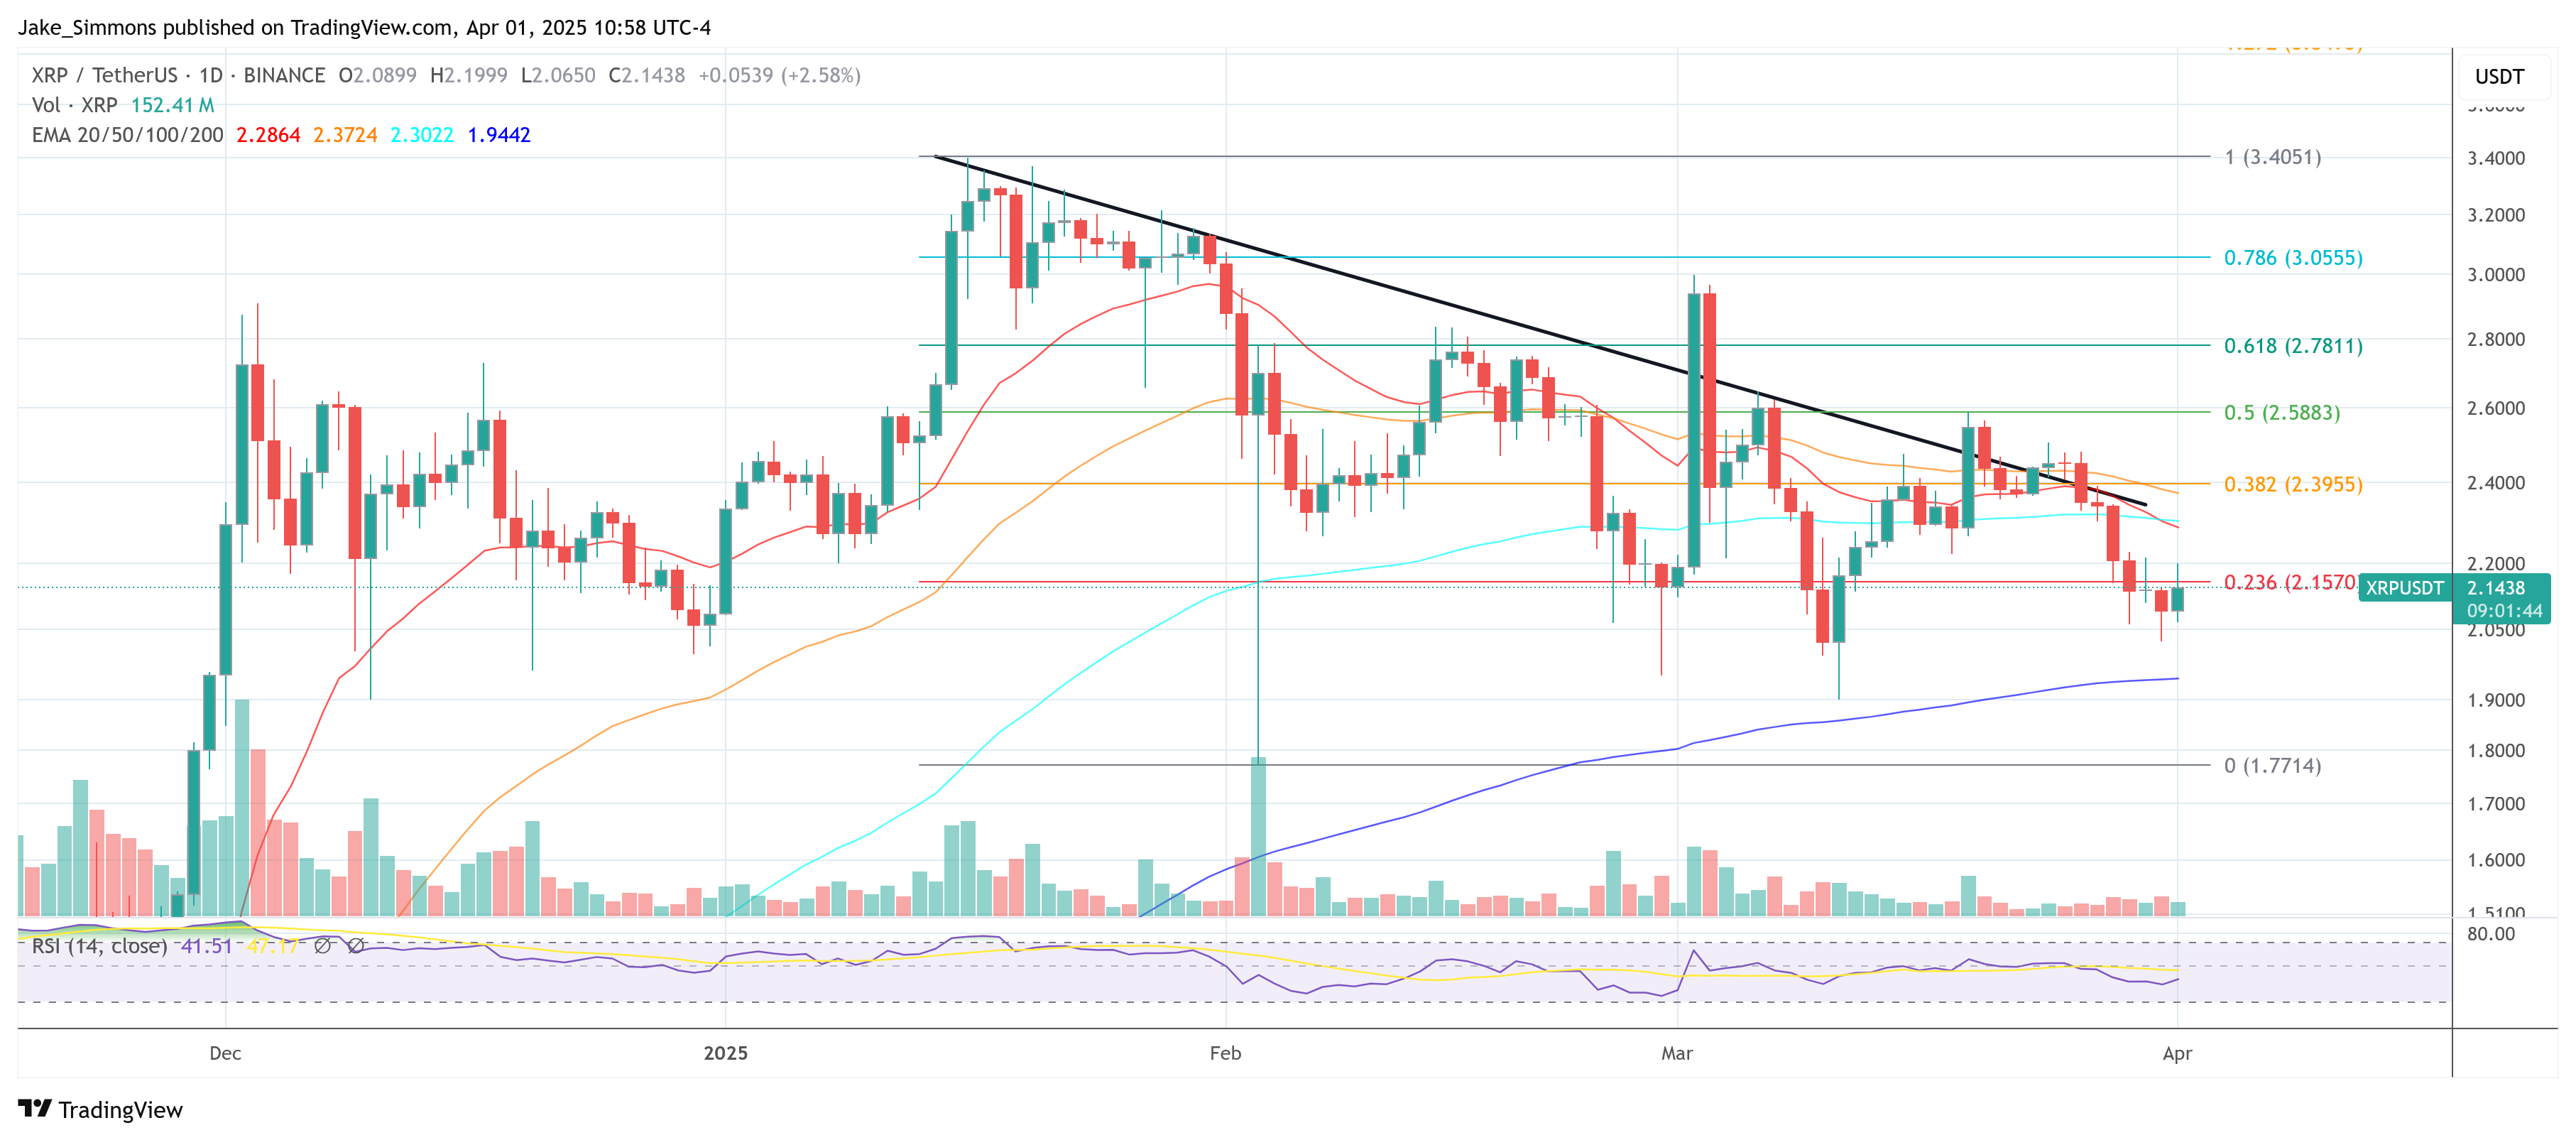
The $XRP price fell as low as $2.0238 on Monday, potentially forming a local bottom. Since then, the $XRP price is up almost 6%, however, the possibility of a deeper retracement remains. Two prominent chartists—CasiTrades (@CasiTrades) and Charting Guy (@ChartingGuy)—have shared their perspectives on whether the token has found its local bottom or if further downside might still be on the table.
Is The $XRP Price Bottom In?
According to CasiTrades’ newly published chart, $XRP appears to have tested the 0.786 Fibonacci retracement at $2.05 and is now showing bullish divergences across multiple timeframes—from the 15-minute all the way to the 4-hour chart. CasiTrades notes that these signals are a positive indicator both for short-term bounces and a potential macro recovery.
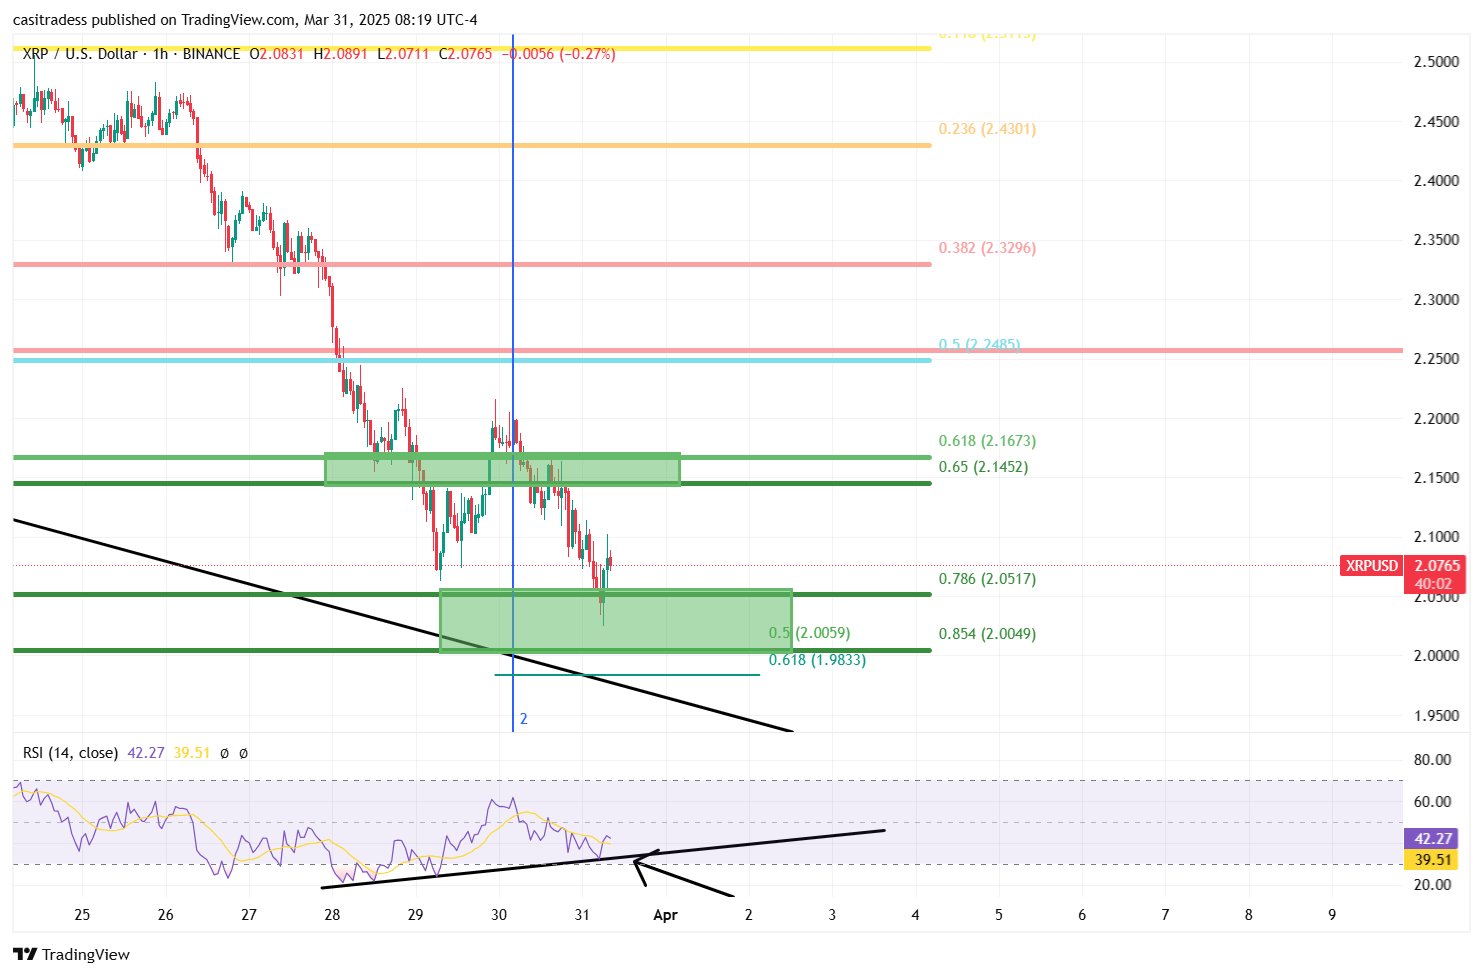
“Was that the bottom for $XRP? After reaching the .786 retrace at $2.05, #$XRP is printing bullish divergences from the 15min all the way up to the 4hr chart. That’s the kind of signal we want to see for both short-term bottom and macro! The bounce is holding so far! CasiTrades notes.
The analyst also points to key resistance at $2.25, suggesting that a convincing break above this level with strong momentum would likely negate the need for another retest of support. “If we break above $2.25 with strong momentum, that would invalidate the need for another support retest—a very bullish sign, CasiTrades writes, adding “$2.00–2.01 remains a support if the $2.05 doesn’t hold.”
Moreover, she highlights a Fib Time Zone 3 that could span the entire month of April, forecasting a “bullish window” for $XRP. According to the chart, once price meets its target, a larger impulse to the upside may follow, with potential resistance lining up at $2.70 and $3.80+.
Meanwhile, Charting Guy addressed that market chatter has surfaced about a possible head and shoulders pattern on the $XRP chart, with a projected breakdown target near $1.15. While acknowledging this bearish formation as a possibility, Charting Guy believes it is unlikely to play out, describing the pattern as “irregular and ugly.”
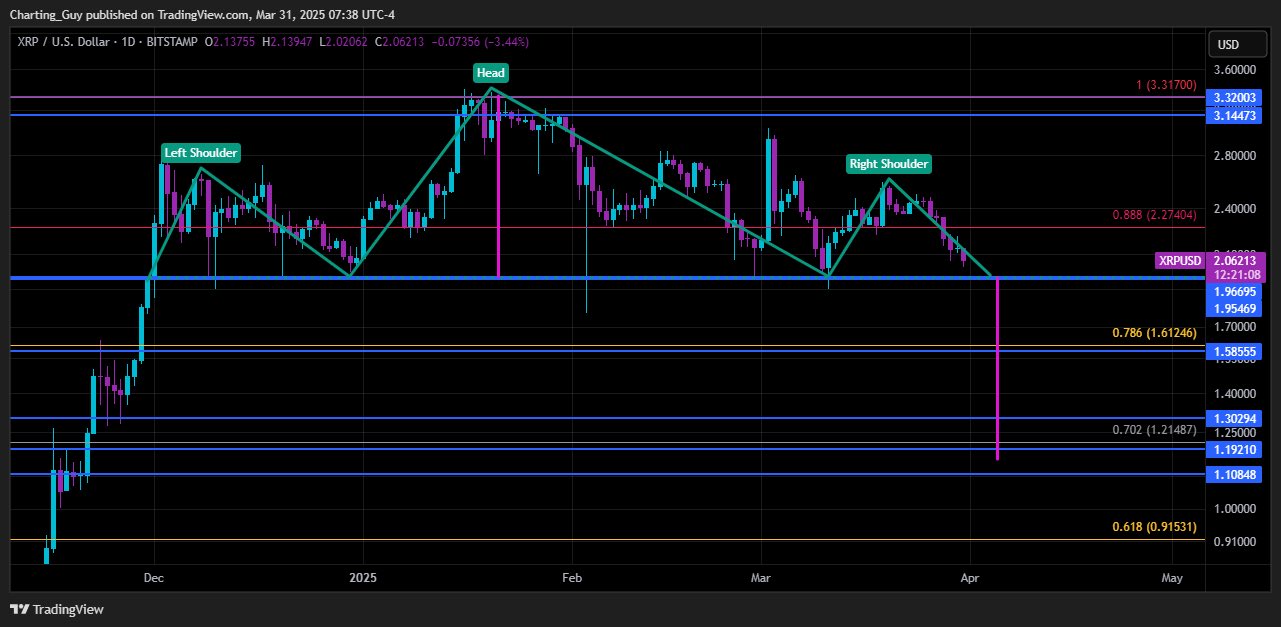
He maintains that $XRP’s overall trend is still biased to the upside, characterized by higher highs and higher lows.“ A lot of people are posting this possible head and shoulders that targets $1.15. I personally don’t think it plays out, but it’s a possibility. If it does happen, it’s just a golden pocket backtest and the chart remains bullish overall,” he says.
Charting Guy draws attention to the $1.70–$1.90 zone that has repeatedly caught wicks in previous pullbacks, with daily closes managing to reclaim $2 or above. He believes that a final corrective dip to fill the March 11 wick lows—potentially down to around $1.90—could mark the end of the current retracement.
Additional support levels are located at the weekly Ichimoku base line at $1.94, the Weekly Supertrend at $1.73 and at the Weekly EMA Ribbon between $1.46 – $1.93.
At press time, $XRP traded at $2.14.