
XRP is in a tough place as it enters a difficult market environment. At the time of writing, XRP price is at $2.23, indicating a 5.83% decline for the past 24 hours.
This decline can be related to the overall market correction, but price action and technical indicators are showing something deeper in the price movement.
XRP Price Analysis
XRP describes choppy-event price action between November 2024 and April 2025. Starting at $0.5040, XRP’s price went all the way up to $2.4660 by early January 2025 for a 389% compound gain.
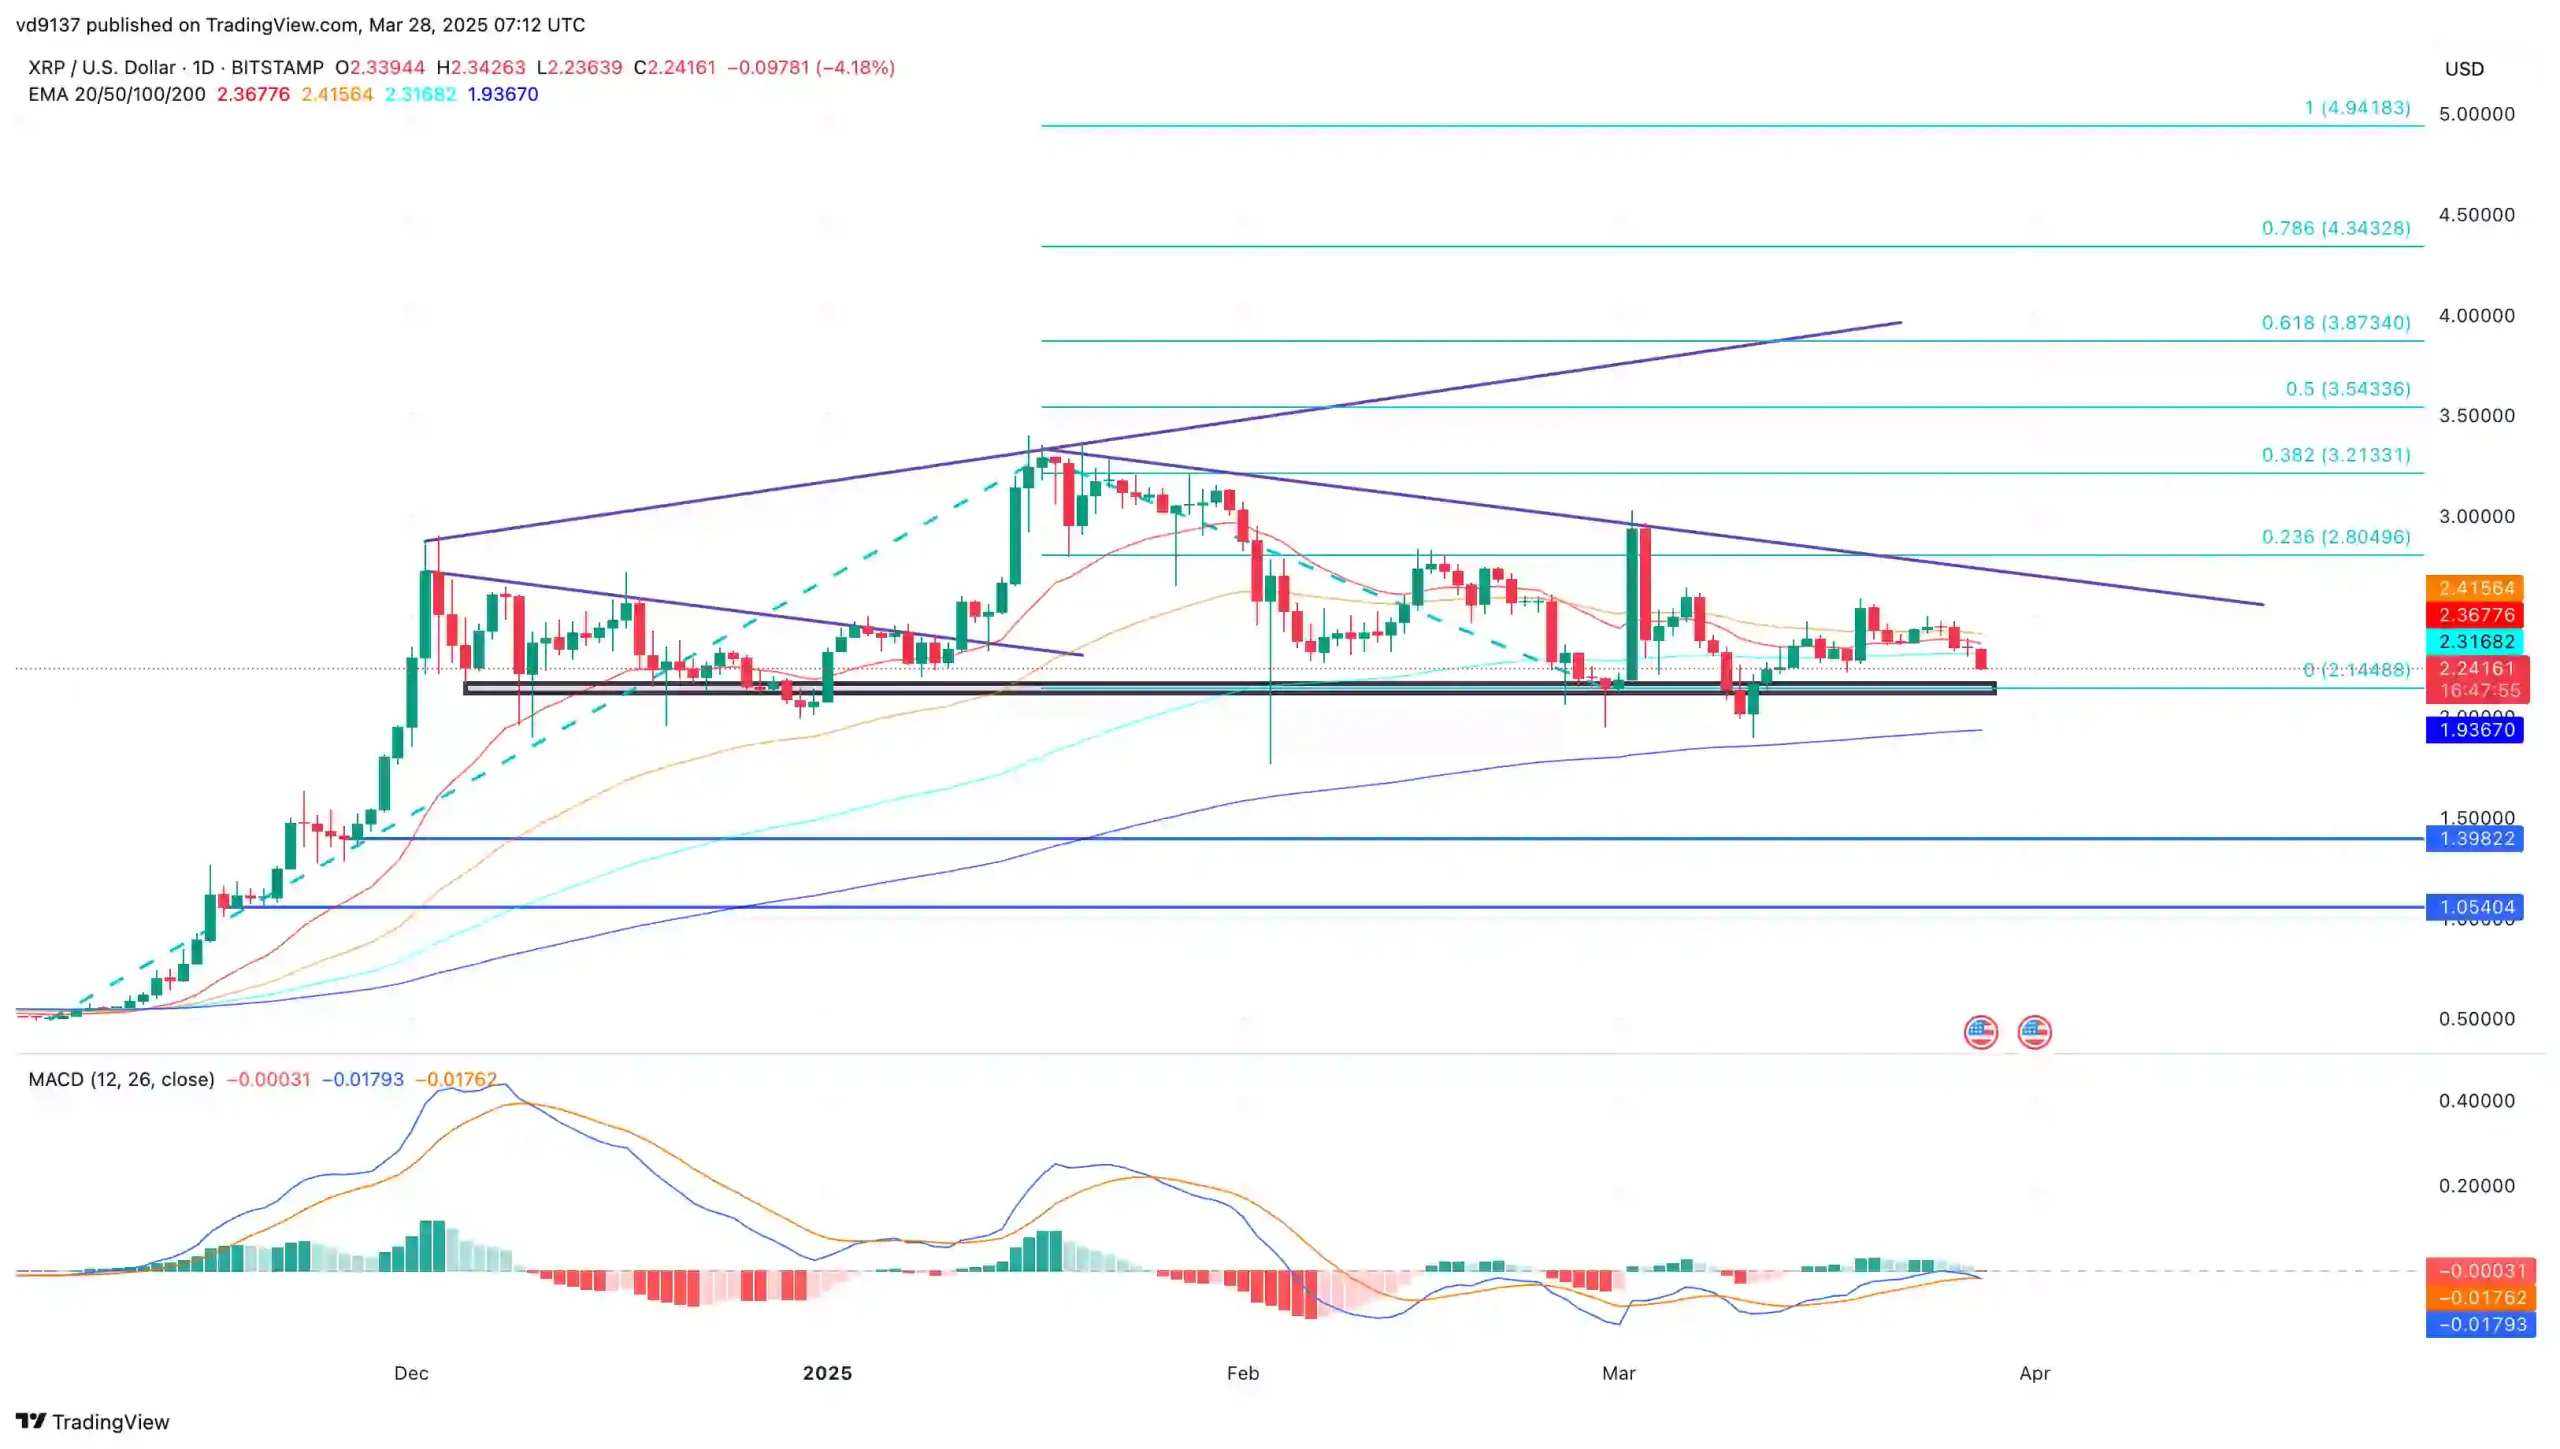
Prior to trading at $2.1464, XRP’s price dropped to an intraday loss of -4.18% on March 28th, 2025. XRP is testing a descending triangle with minor resistance at $2.24161 and minor support down at $1.93870.
If the price breaks below this minor support level, XRP can head down to target $1.50404. Conversely, an organized effort by bulls will begin if it breaks above $2.4660.
If $XRP can break above $3, it would invalidate the current head-and-shoulders pattern, potentially flipping the outlook bullish. pic.twitter.com/B6mrtXm1TS
— Ali (@ali_charts) March 28, 2025
In a recent tweet by Ali on X, formerly known as twitter, should $XRP surge past $3, it would nullify the existing head-and-shoulders formation. This will shift the market sentiment to a more bullish perspective.
Technical Indicators Signal XRP’s Future
At a value of 49.54, the Relative Strength Index (RSI) is nearing oversold territory, potentially triggering buying interest if it crosses below 40. The Moving Average Convergence Divergence (MACD) has a bearish outlook, as MACD is at -0.0179 while the signal line is at -0.016.
Since the MACD line crossed the signal line, bears are still pressing this chart for further downside, likely forcing the price of XRP to $1.93870 in the near term. However, the narrowing histogram does hint at the possibility of a trend reversal if bulls step in.
This means that if the price breaks above $2.2215, crypto bulls could help push it to $2.4660. However, without significant support for the XRP price, it could try to retest lower levels toward $1.50404.
Liquidation Heatmap: A Contest Between Bulls and Bears
The liquidation heatmap has experienced extreme activity characterized by failed short liquidations (red) recently dominating price action concerning short liquidation, particularly around the $2.1464 range. There are a few long liquidations (green), indicating that bears are still in charge.
If a massive price were to suddenly spike to the upside, there could potentially be a short squeeze, sending the price to $2.31682. Otherwise, if slight selling pressure continues, the price will go lower, testing support at $1.93870.
Conclusion: What Lies Ahead for XRP?
The circumstances surrounding XRP remain grim on the short-term outlook. Overall sentiment, liquidation data, and technical indicators present reasons for cautiousness. The key support level remains $1.93870, and if this level is lost, there could be further downside.
However, if XRP can get back above $2.24161, it might spark some bullish momentum. XRP remains precariously on the tipping point. Watching for a decisive breach above $2.4660 would indicate bullish characteristics, while a failure of support could lead the price down to $1.50404.