
The Coin Days Destroyed (CDD) metric of Dogecoin created extensive market insight that revealed accumulation patterns for the long-term holders (LTHs) along with distribution movements.
Dogecoin Price CDD Metric Reveals Activities of LTHs
The 90-day average CDD depicted coin idle duration before any movement. Dogecoin’s falling CDD signaled that holders were accumulating DOGE with increased confidence.
However, a rise in CDD could have indicated that holders were transferring their older coins, which usually led to increased selling. For instance, CDD increased when DOGE price peaked at $0.46 in December and January 2025.
The price surge indicated that holding investors took profit distributions, and big players gradually injected DOGE into the market. That was typical behavior during market peaks.
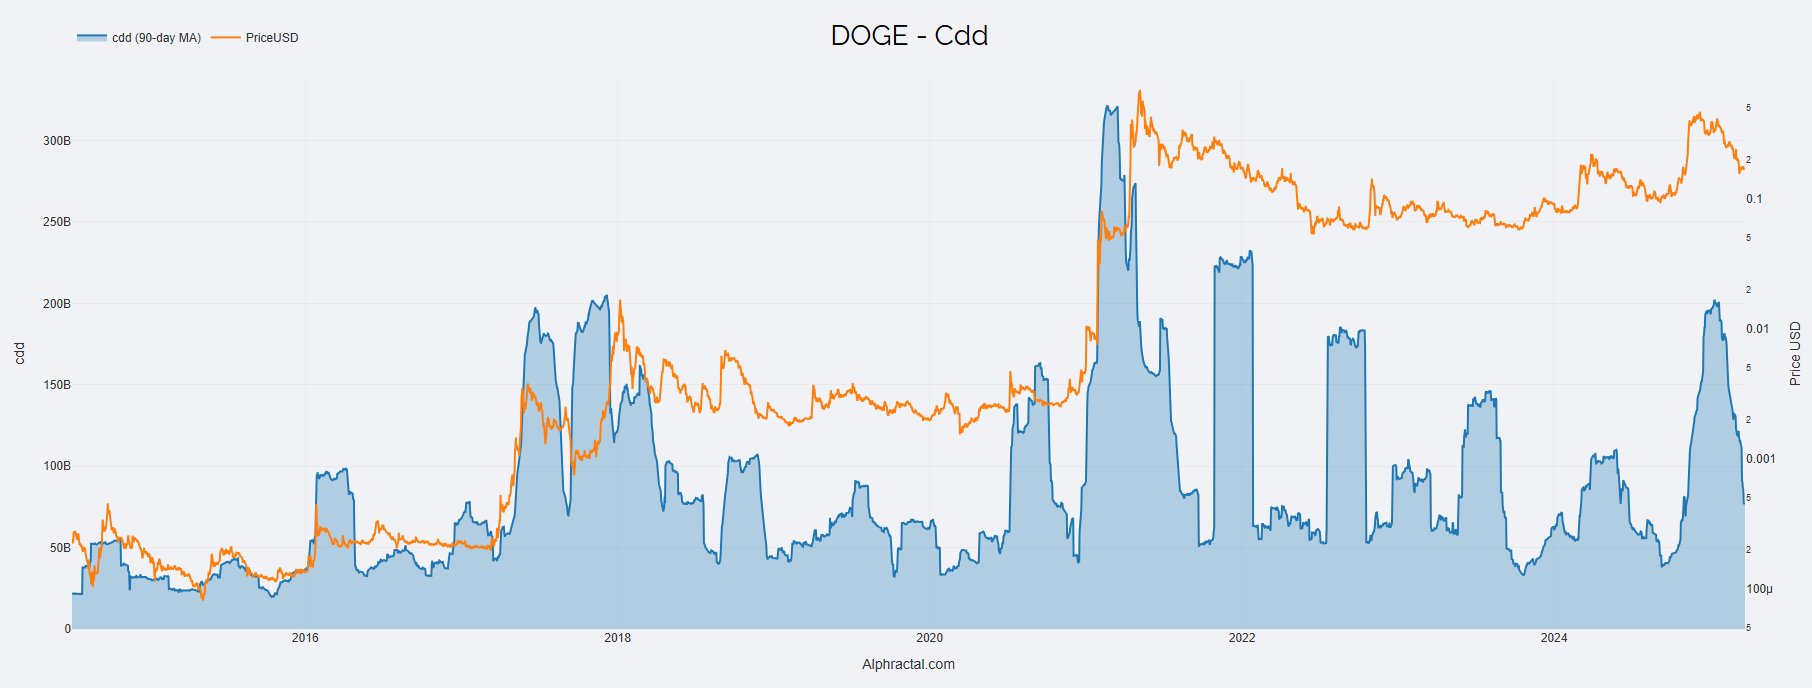
The recent CDD decline of Dogecoin indicated that its holders were starting to accumulate rather than continue selling. Price stabilization occurred because long-term holders chose not to sell their DOGE. It decreased selling pressure in the market.
Continued accumulation patterns for Dogecoin may create both price stability and upward price potential because positive investor sentiment will grow stronger.
DOGE Breakout Coincides with Bullish Crossover
For price action, the symmetrical triangle pattern that DOGE followed showed a typical pattern of stabilization. That could end in powerful price moves. Dogecoin price reached $0.183 during this breakout from the pattern at $0.178 while showing a small increase.
Analyzing the breakout pattern revealed the potential to continue upwards, which could extend DOGE to $0.21, a 16% gain. Traders depicted a bifurcated condition through the ascending support starting at $0.146 and horizontal resistance at $0.178 before the price movement shifted.
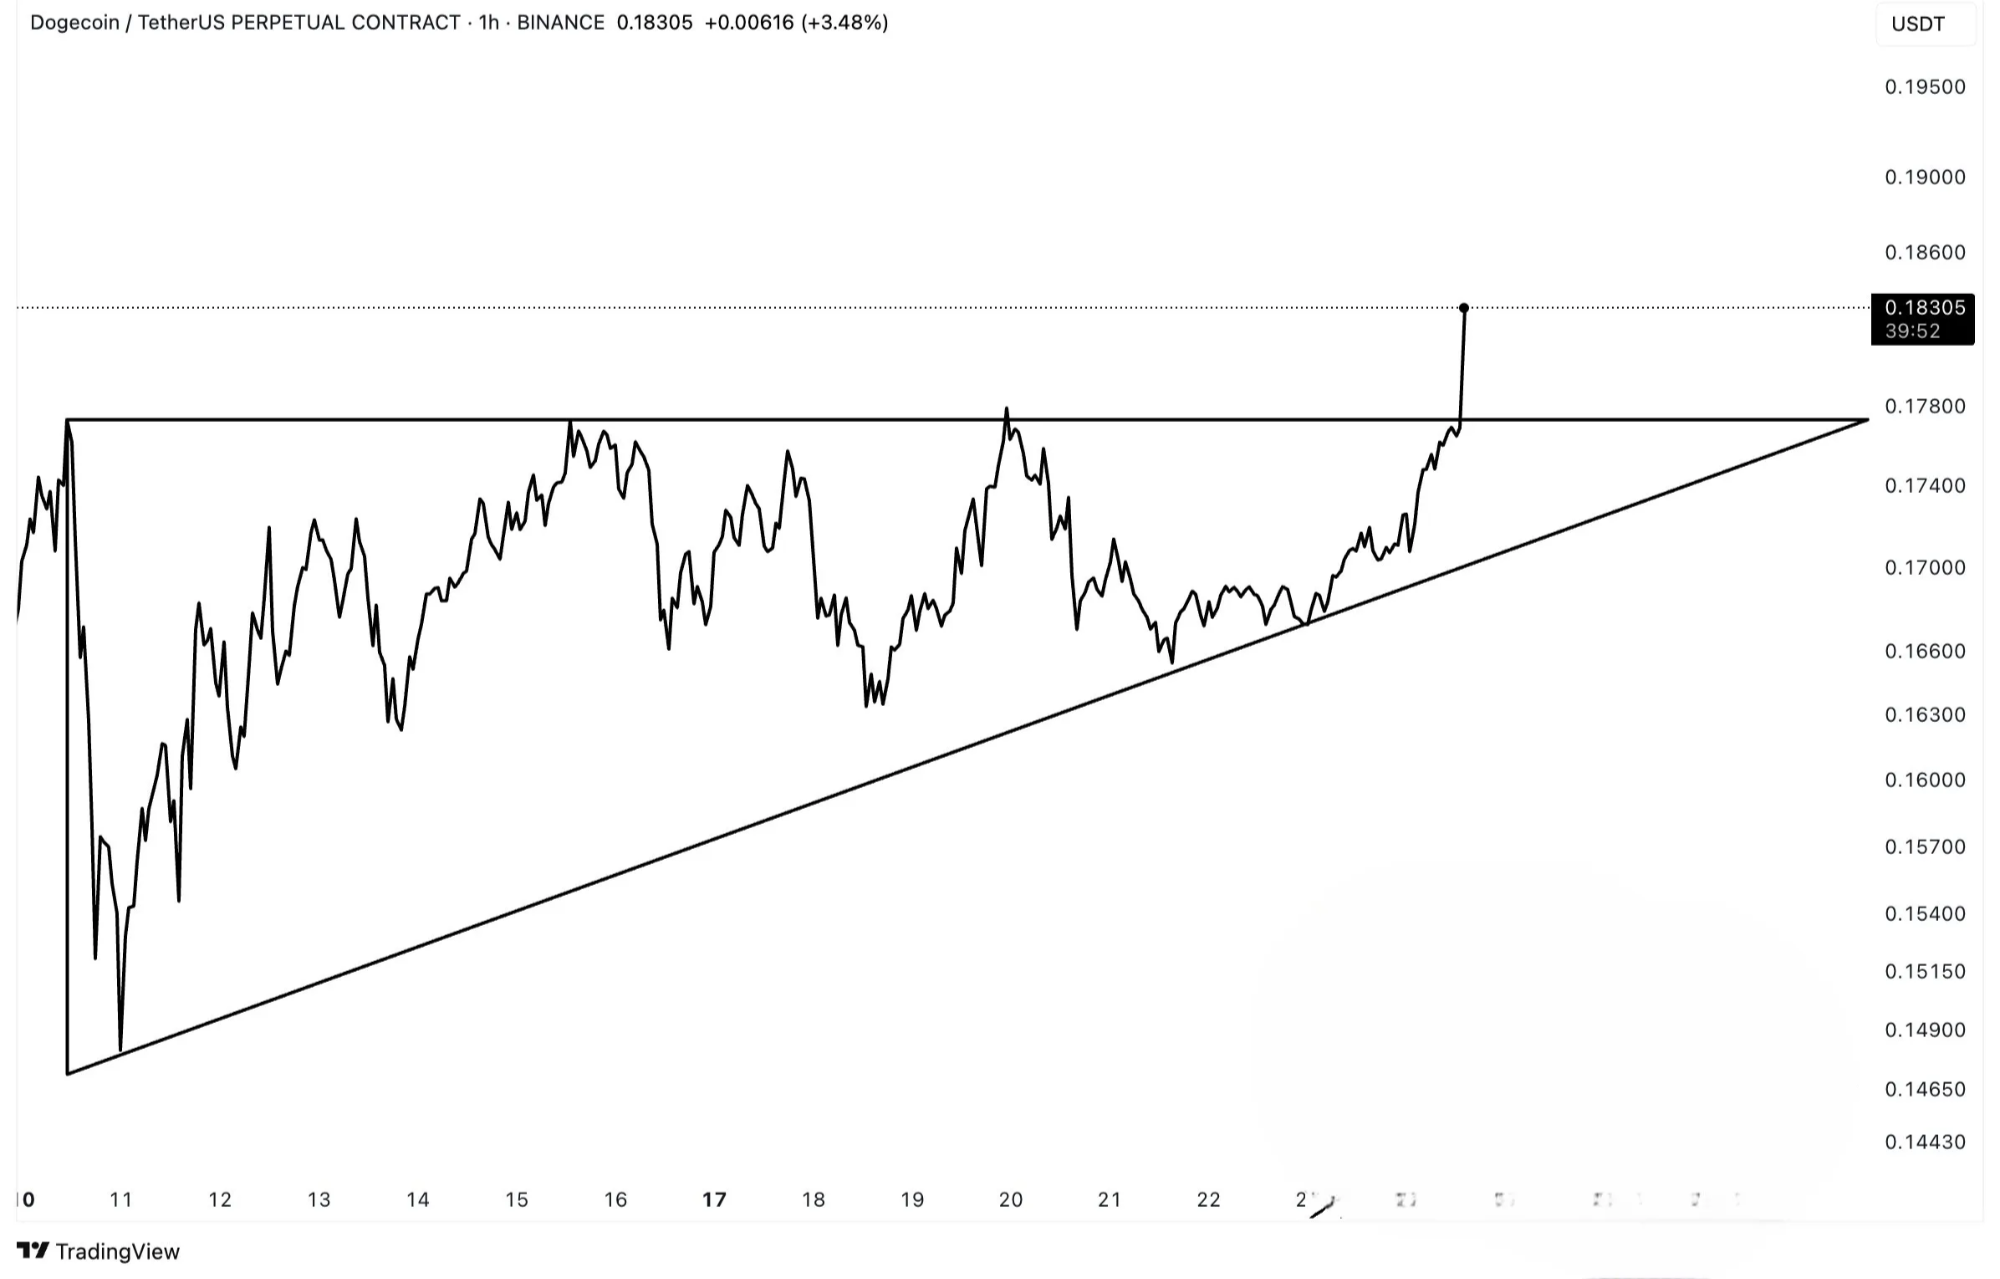
The investors’ takeover above $0.178 could lead to DOGE reaching $0.211. However, this presented a critical test scenario: a price decrease below $0.170 would indicate a false breakout leading to lower prices toward $0.170 or $0.154, especially if momentum slowed down.
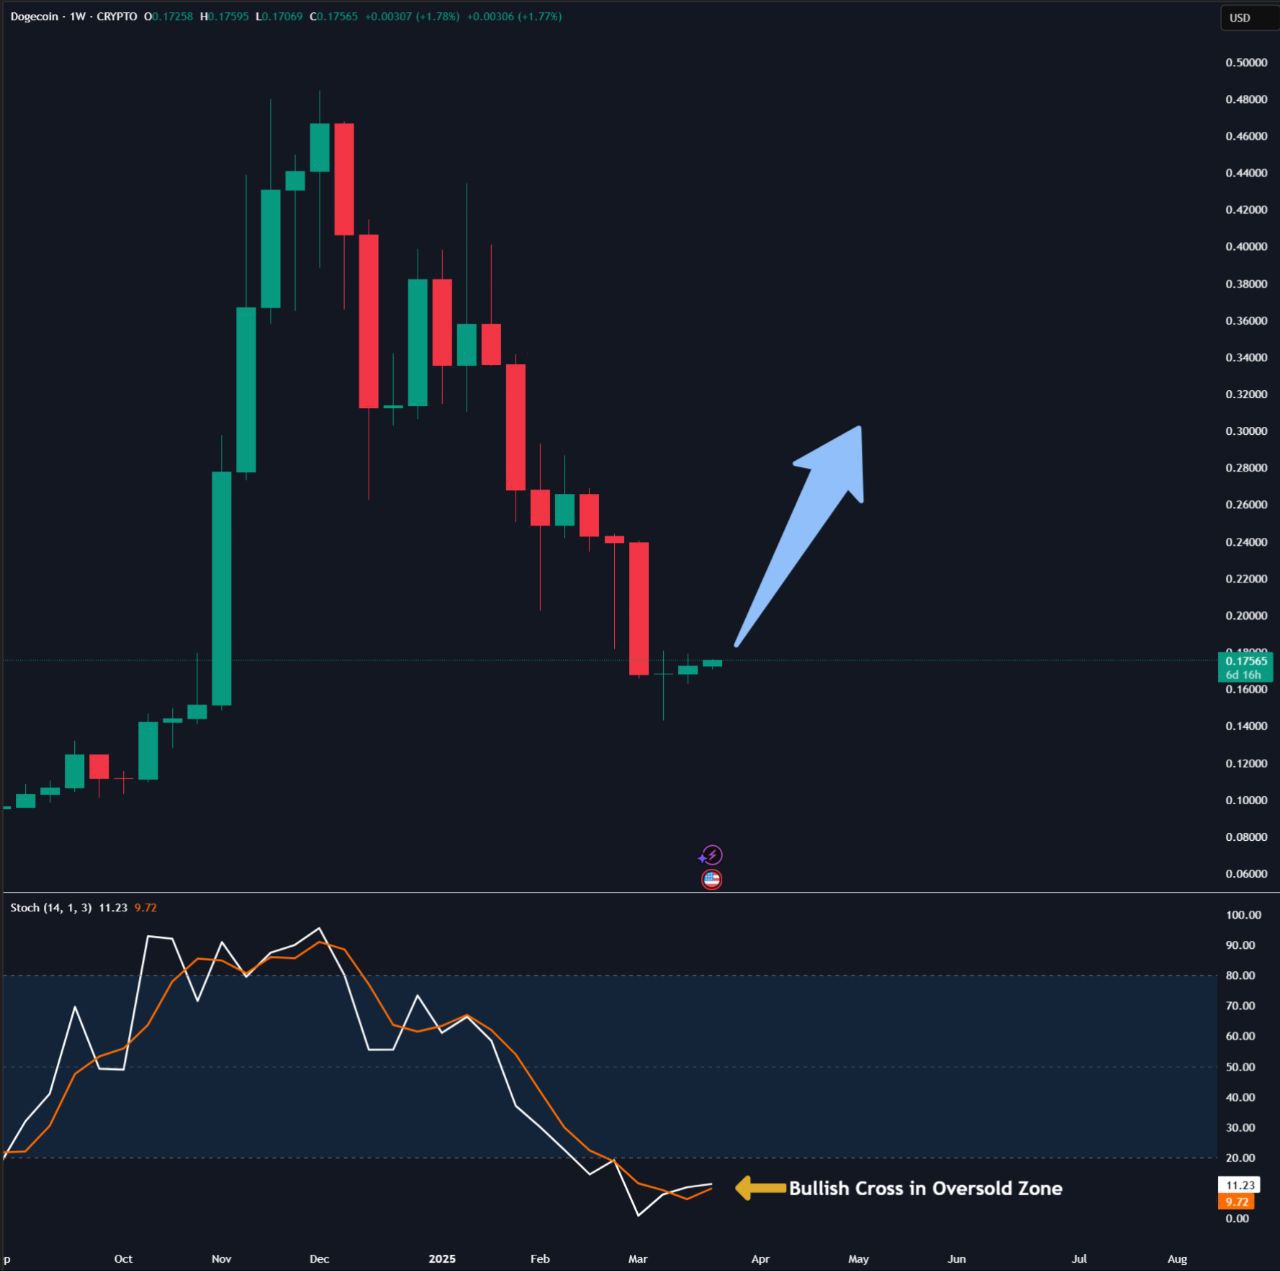
More analysis for the DOGE weekly chart indicated a potential price surge as the Stochastic indicator (14, 1, 3) crossover appeared in the oversold region below 20. That indicated DOGE might experience a precious price turnaround as oscillator readings coincided with a Dragon Fly Doji candle.
What to Expect from DOGE Price
Dogecoin price reached its peak at $0.4000 in late 2024, then fell to $0.17465 as the market consolidated because of alternating small green and red candle formations.
The setup indicated that DOGE might encounter resistance at $0.2800 based on its technical configuration of the candles at that zone. A price growth through $0.2800 could drive DOGE up to $0.4000. That could start an altseason and bring normies into the market to increase altcoin value.
Dogecoin could delay its price rally if it fails to clear the $0.2800 resistance because it would likely return to the test of the $0.1500 support level.
This combination of shifting momentum across the Stochastic’s crossover series and the consolidation pattern at $0.17465 provides essential trading signals for future movement. Breakout success demonstrated strength, but a rejection could extend bearish patterns.