Fidelity’s director of global macro, Jurrien Timmer, is updating his outlook on markets following an across-the-board correction in equities.
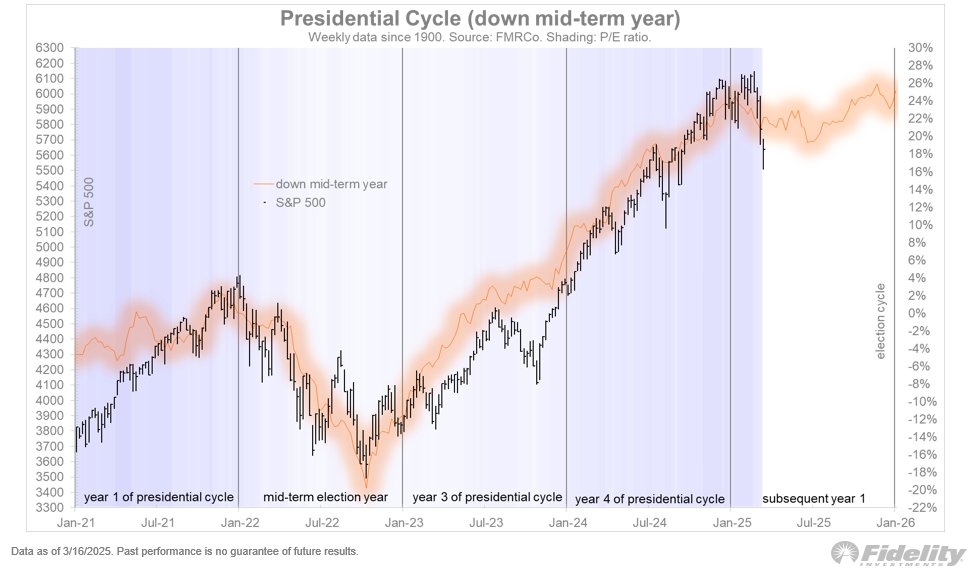
In a post on the social media platform X, Timmer shares with his 194,000 followers a chart depicting an average of the S&P 500’s returns during the specific years of presidential terms.
Timmer’s chart suggests that the S&P 500 is more or less following the historical average of previous presidential cycles and that its current drawdown could conclude somewhere around July of this year.
“While I wouldn’t put too much weight on this indicator, the iteration of the Presidential cycle in which the mid-term year (2022) is down, continues to play out nicely. We are now in ‘year 5’ (if that makes any sense), and that year has been down on average for the first six months. It suggests a modest but multi-month corrective period.”

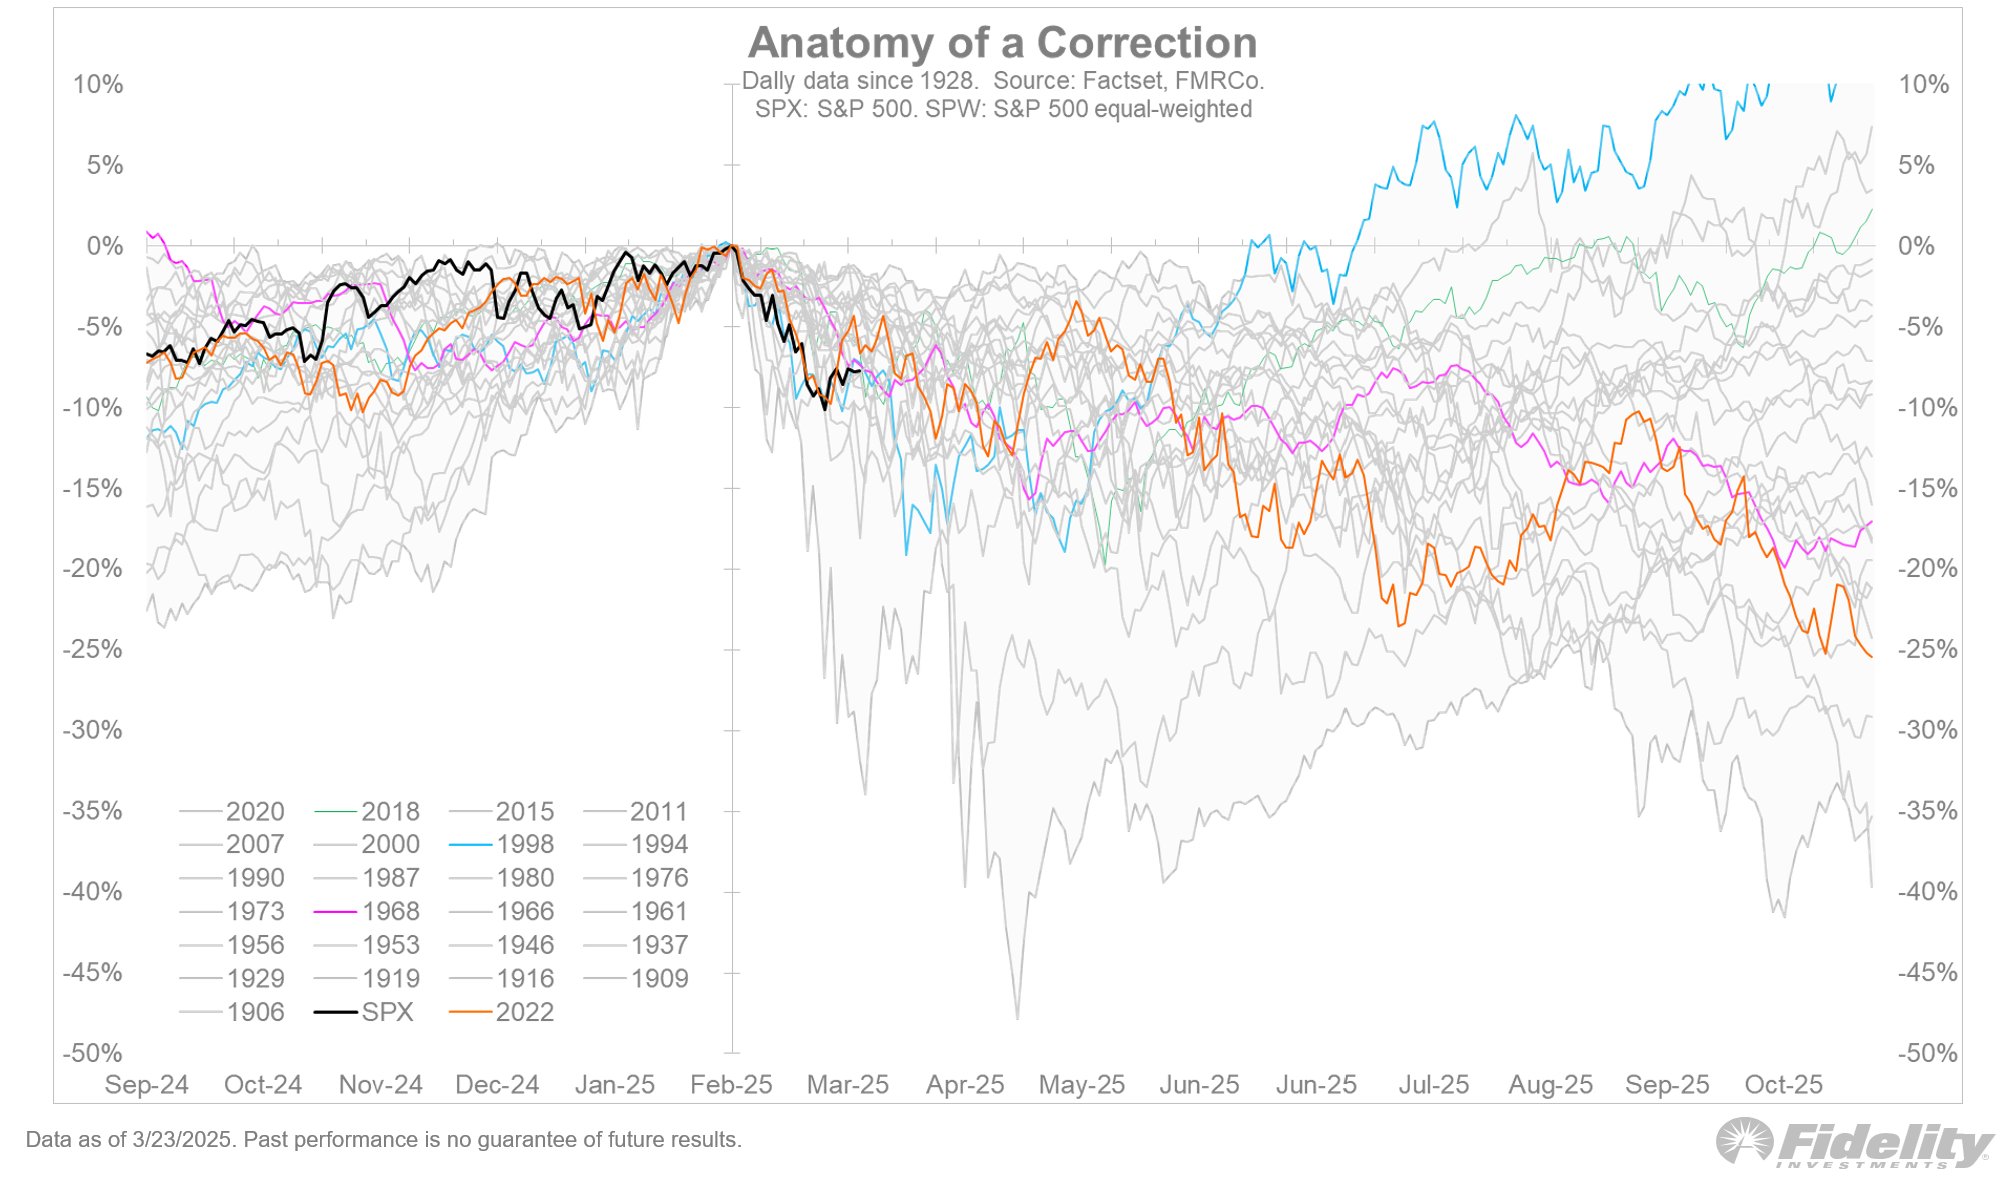
Zooming in, Timmer shares a chart tracking 26 different corrections in the S&P 500 all the way back to 1906. Looking at every correction, Timmer says the current market dip seems reminiscent of 2018, implying that the S&P 500 could bottom out around the 4,900 level.
“Last week’s reprieve from the tape bombs (which have become such a feature in 2025) allowed the markets to catch their breath. For now, we remain in 10% correction territory while we wonder whether the next 10% will be up or down.
The chart below shows all corrections and bear markets since 1900. This one feels a bit like late 2018, which was a 20% correction purely driven by multiple compression.”

 dailyhodl.com
