Dogecoin is drawing attention after it spiked to $0.1842 at the time of writing, according to the chart on CoinMarketCap, a 5.13% increase in the last 24 hours. The spike follows a steady rise from $0.1756 on March 24, 2025, and the price positions Dogecoin as the eighth-largest cryptocurrency.
The market cap is at $27.378 billion with a 24-hour volume of trading at $1.558 billion (up 117.39%), suggesting active trading in the market. Should Dogecoin be able to keep the momentum, or will it have a pullback?
Dogecoin Analysis: Will Multi-Triangle Breakout Lead to a 16% Surge?
A recent tweet by Ali on X, shows Dogecoin price action on a 1-hour time frame in the TradingView chart below, exhibiting a breakout from an ascending triangle pattern. On March 24, 2025, the Dogecoin price moved through the triangle’s upper resistance of $0.18305, indicating a bullish breakout condition.
#Dogecoin $DOGE is breaking out of a triangle, which can result in a 16% upswing! pic.twitter.com/25flXRvfcQ
— Ali (@ali_charts) March 24, 2025
The chart indicates Dogecoin could rise 16% to approximately $0.19250 if the breakout condition holds. Doge is currently trading at approximately $0.1842, which supports this bullish breakout. If the momentum continues to the upside, Dogecoin could reach the price target of $0.19250.
If the price fails to hold above $0.18305, this may push the price back to the support zone of $0.17500, which is the lower trendline of the triangle.
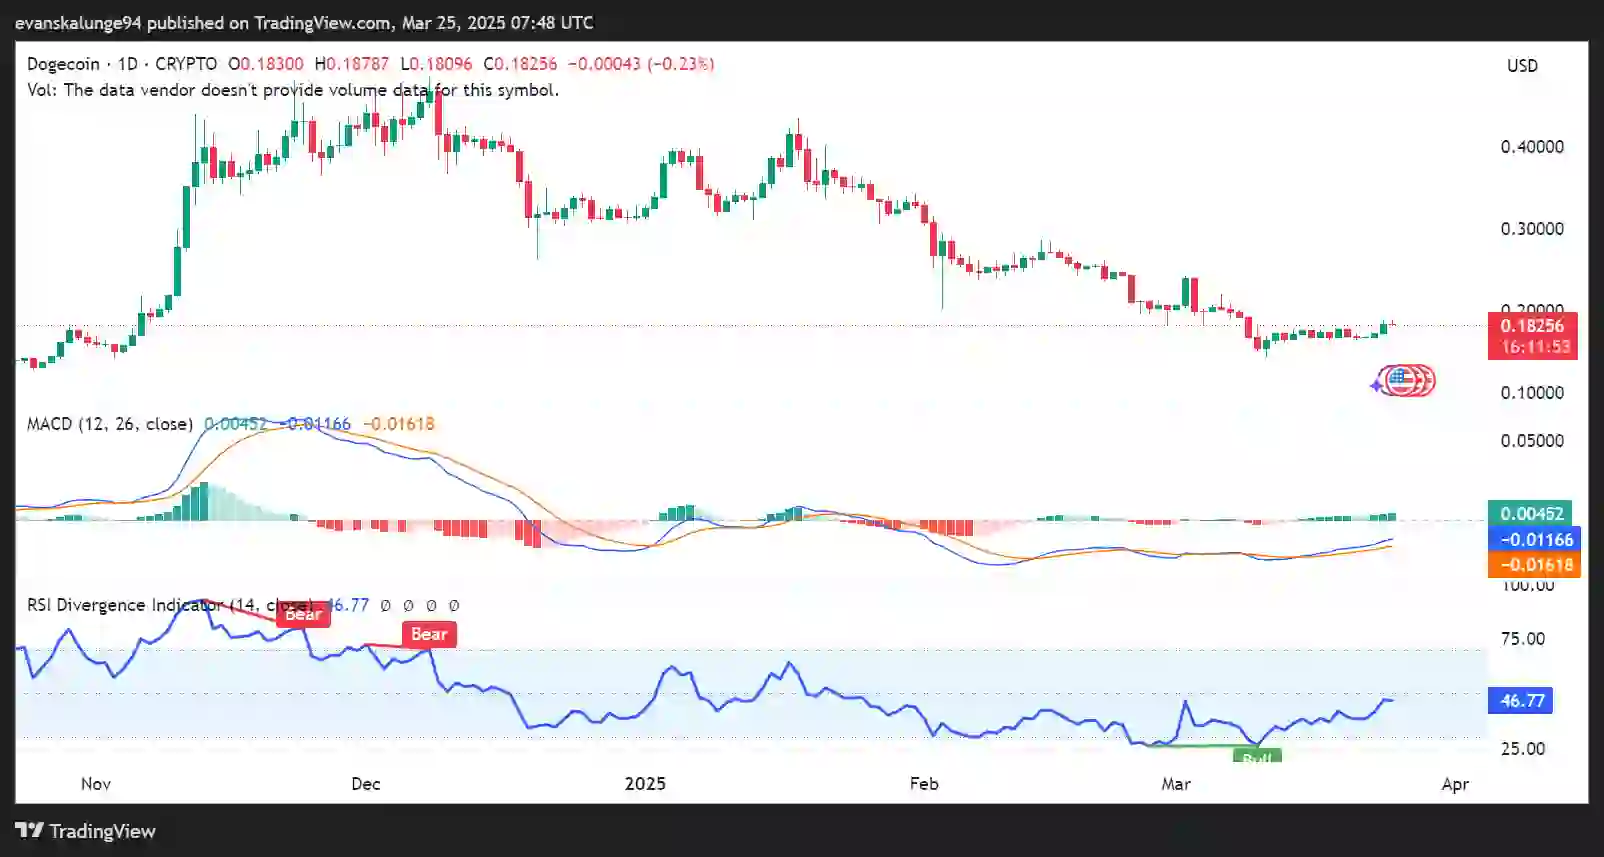
Technical Indicators: Are the RSI and MACD Sending Mixed Signals?
The RSI presently sits at 47.13, implying it has a neutral momentum and can rise before it reaches the overbought level; however, MACD shows some bearish divergence with a negative value on the histogram of -0.01160, indicating a waning momentum. Therefore, traders want to see a MACD crossover with the MACD above the signal line to continue to confirm bullishness.
In addition, while the volume spike on the CoinMarketCap chart supports the breakout that we saw, the neutral RSI indicates that buying pressure is fading, and we could potentially be heading into consolidation.
source:tradingview
Liquidation Trends: Is the Market Being Driven by Shorts or Longs?
Since November of 2022, the short liquidations (red bars) have had a rally phase with subsequent spikes on price movements. With price rallies, mainly during the December 2022 and March 2023 timeframe, indicating that those significantly bearish in trades were getting squeezed. The indicator of the long position liquidation (green bars) remains small and modest, suggesting that bullish traders remain strong.
The imbalance between the long liquidation position and short liquidation position indicates the bullish trend of shorts getting squeezed, thereby creating a cryptocurrency price rally. However, this trend could completely change if we see long traders unravel their positions through a liquidation phase in the next potential area of resistance at $0.2000.
Conclusion: Will Dogecoin Continue to Tail Wag?
Dogecoin’s rise to $0.1842 is affirmed by bullish strength, as evident from a triangle breakout and short liquidations; however, the bearish MACD readings and neutral RSI signal caution and a potential consolidation. If Dogecoin can maintain a position above $0.18305, there is a reasonable opportunity for it to reach $0.19250, but we recommend placing stop-losses at around $0.17500 to hedge risk in this volatile market.