As of March 16, 2025, XRP is trading at $2.28, reflecting a market capitalization of $132 billion. Over the past 24 hours, XRP’s trading volume reached $2.76 billion, with intraday prices fluctuating between $2.28 and $2.43. Currently, XRP is down 32.8% from its all-time high of $3.40.
XRP
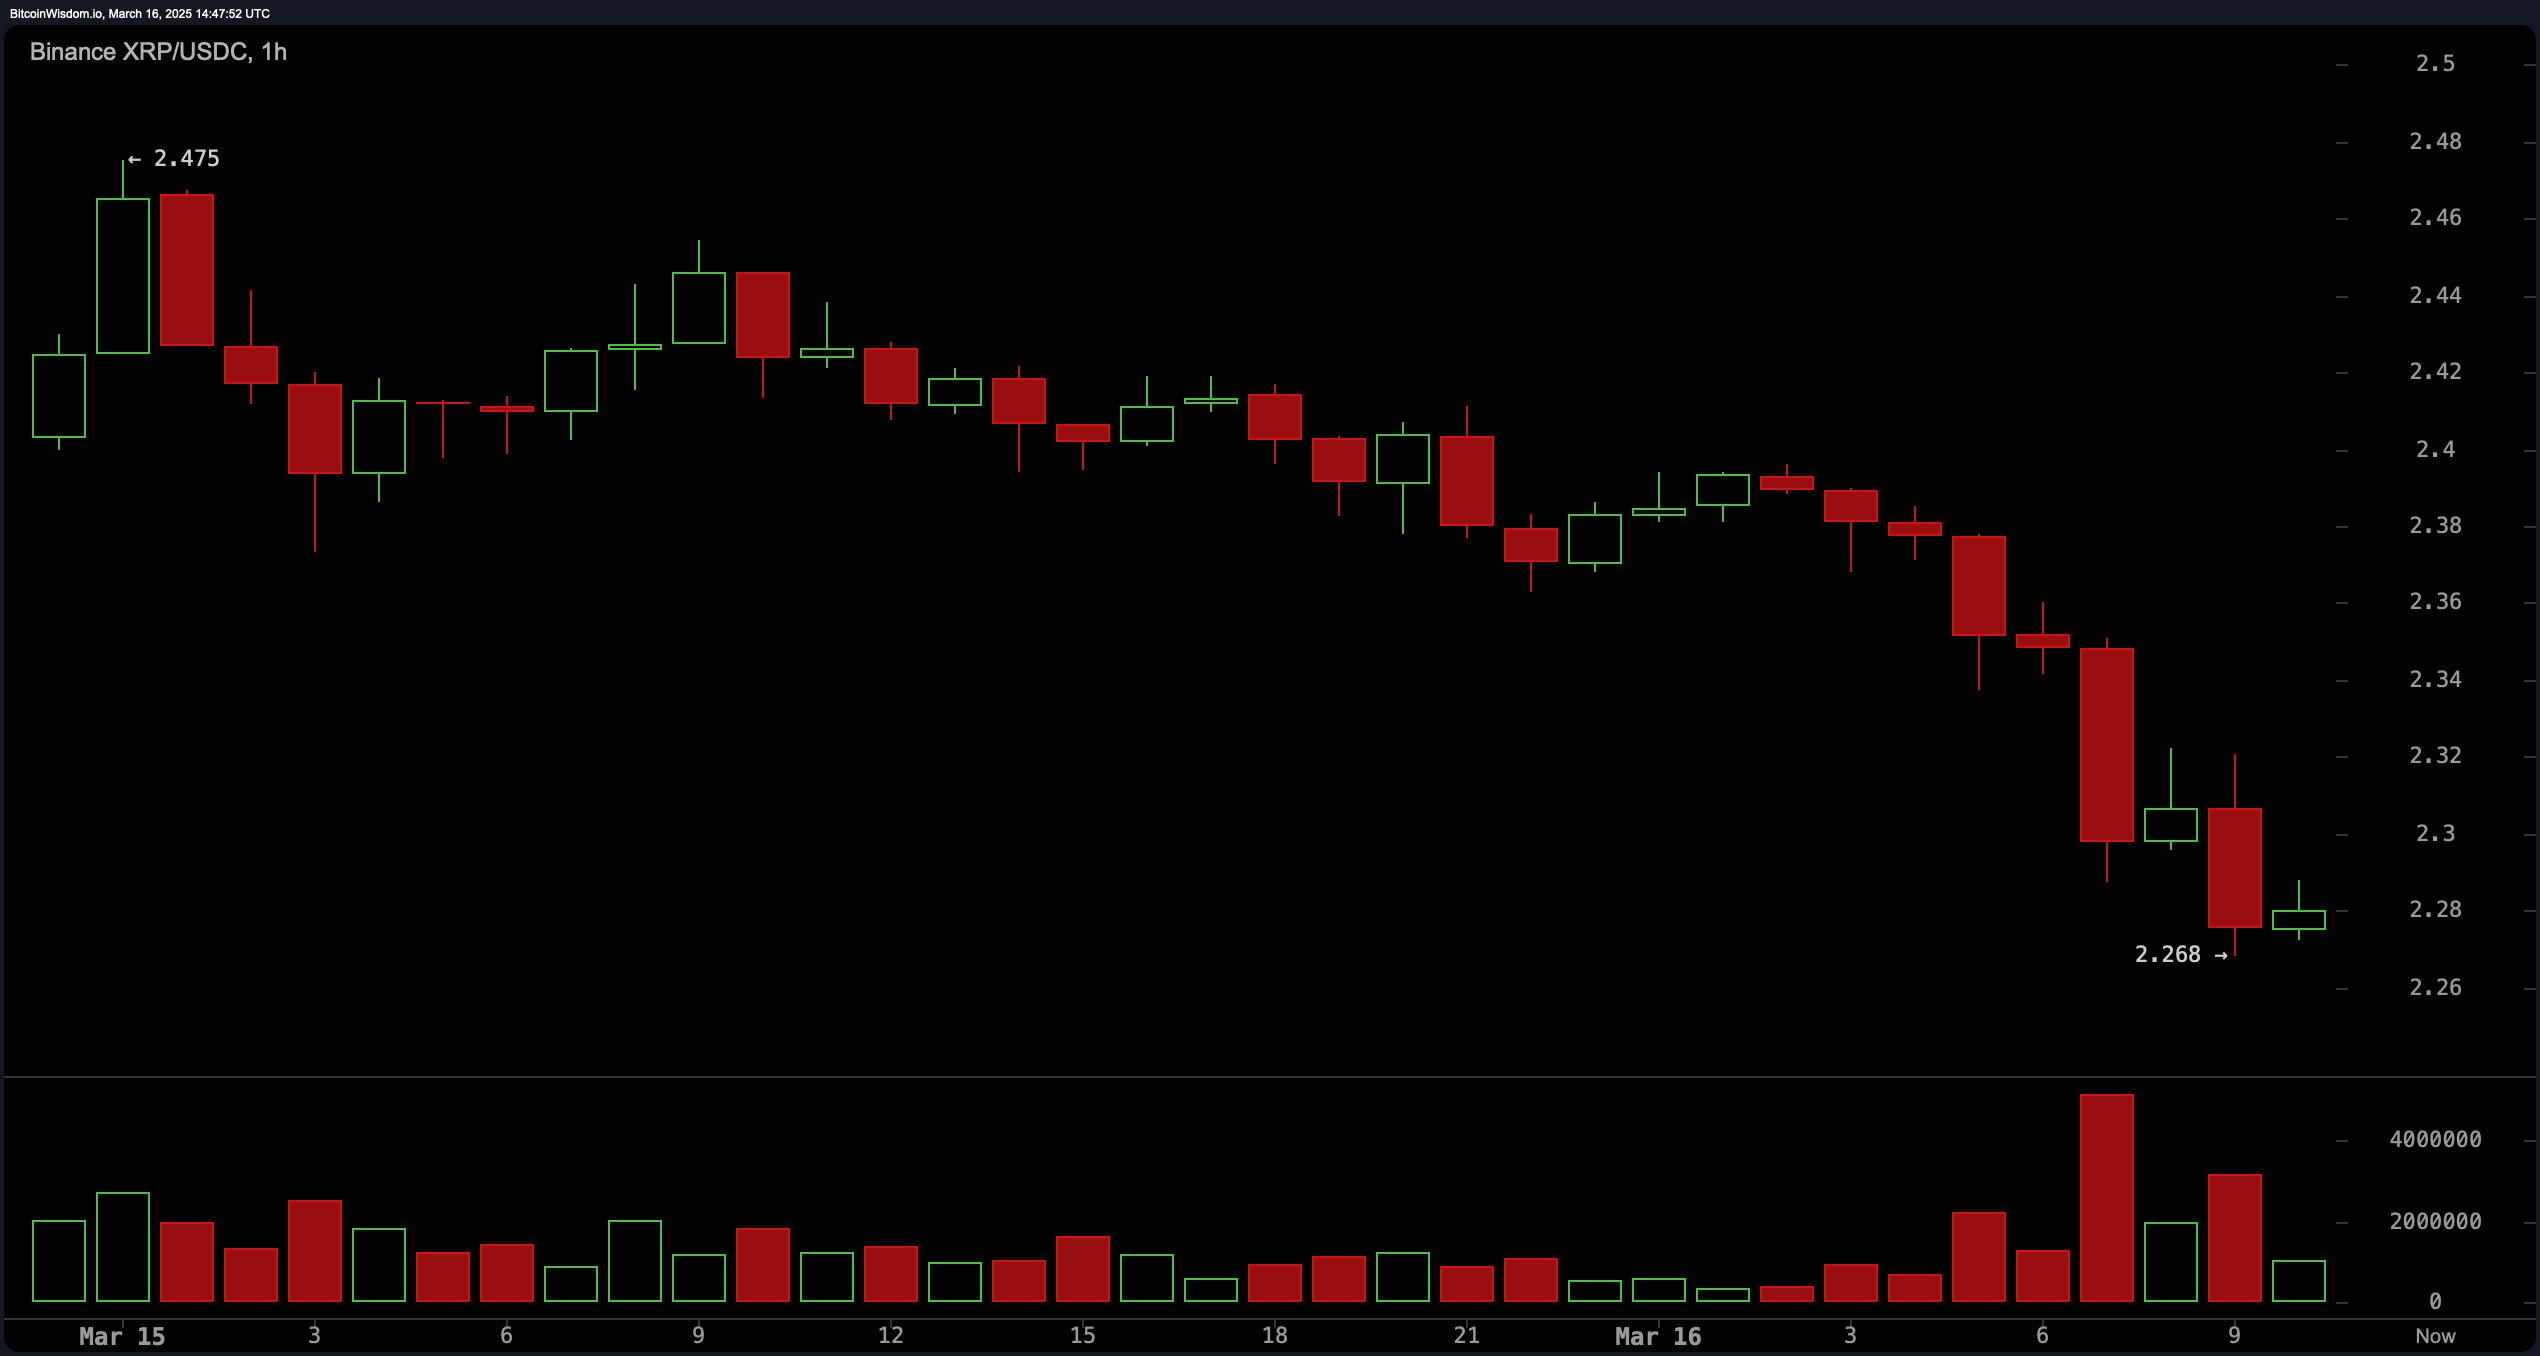
On the 1-hour chart, XRP exhibits a consolidation pattern characterized by tight price movements between $2.27 and $2.44. This range-bound behavior suggests a temporary equilibrium between buying and selling pressures. The relative strength index (RSI) indicates a neutral stance, hovering around the 50 mark, implying neither overbought nor oversold conditions. The moving average convergence divergence (MACD) displays a flat trajectory, with the MACD line intersecting the signal line, signaling a lack of strong momentum in either direction.
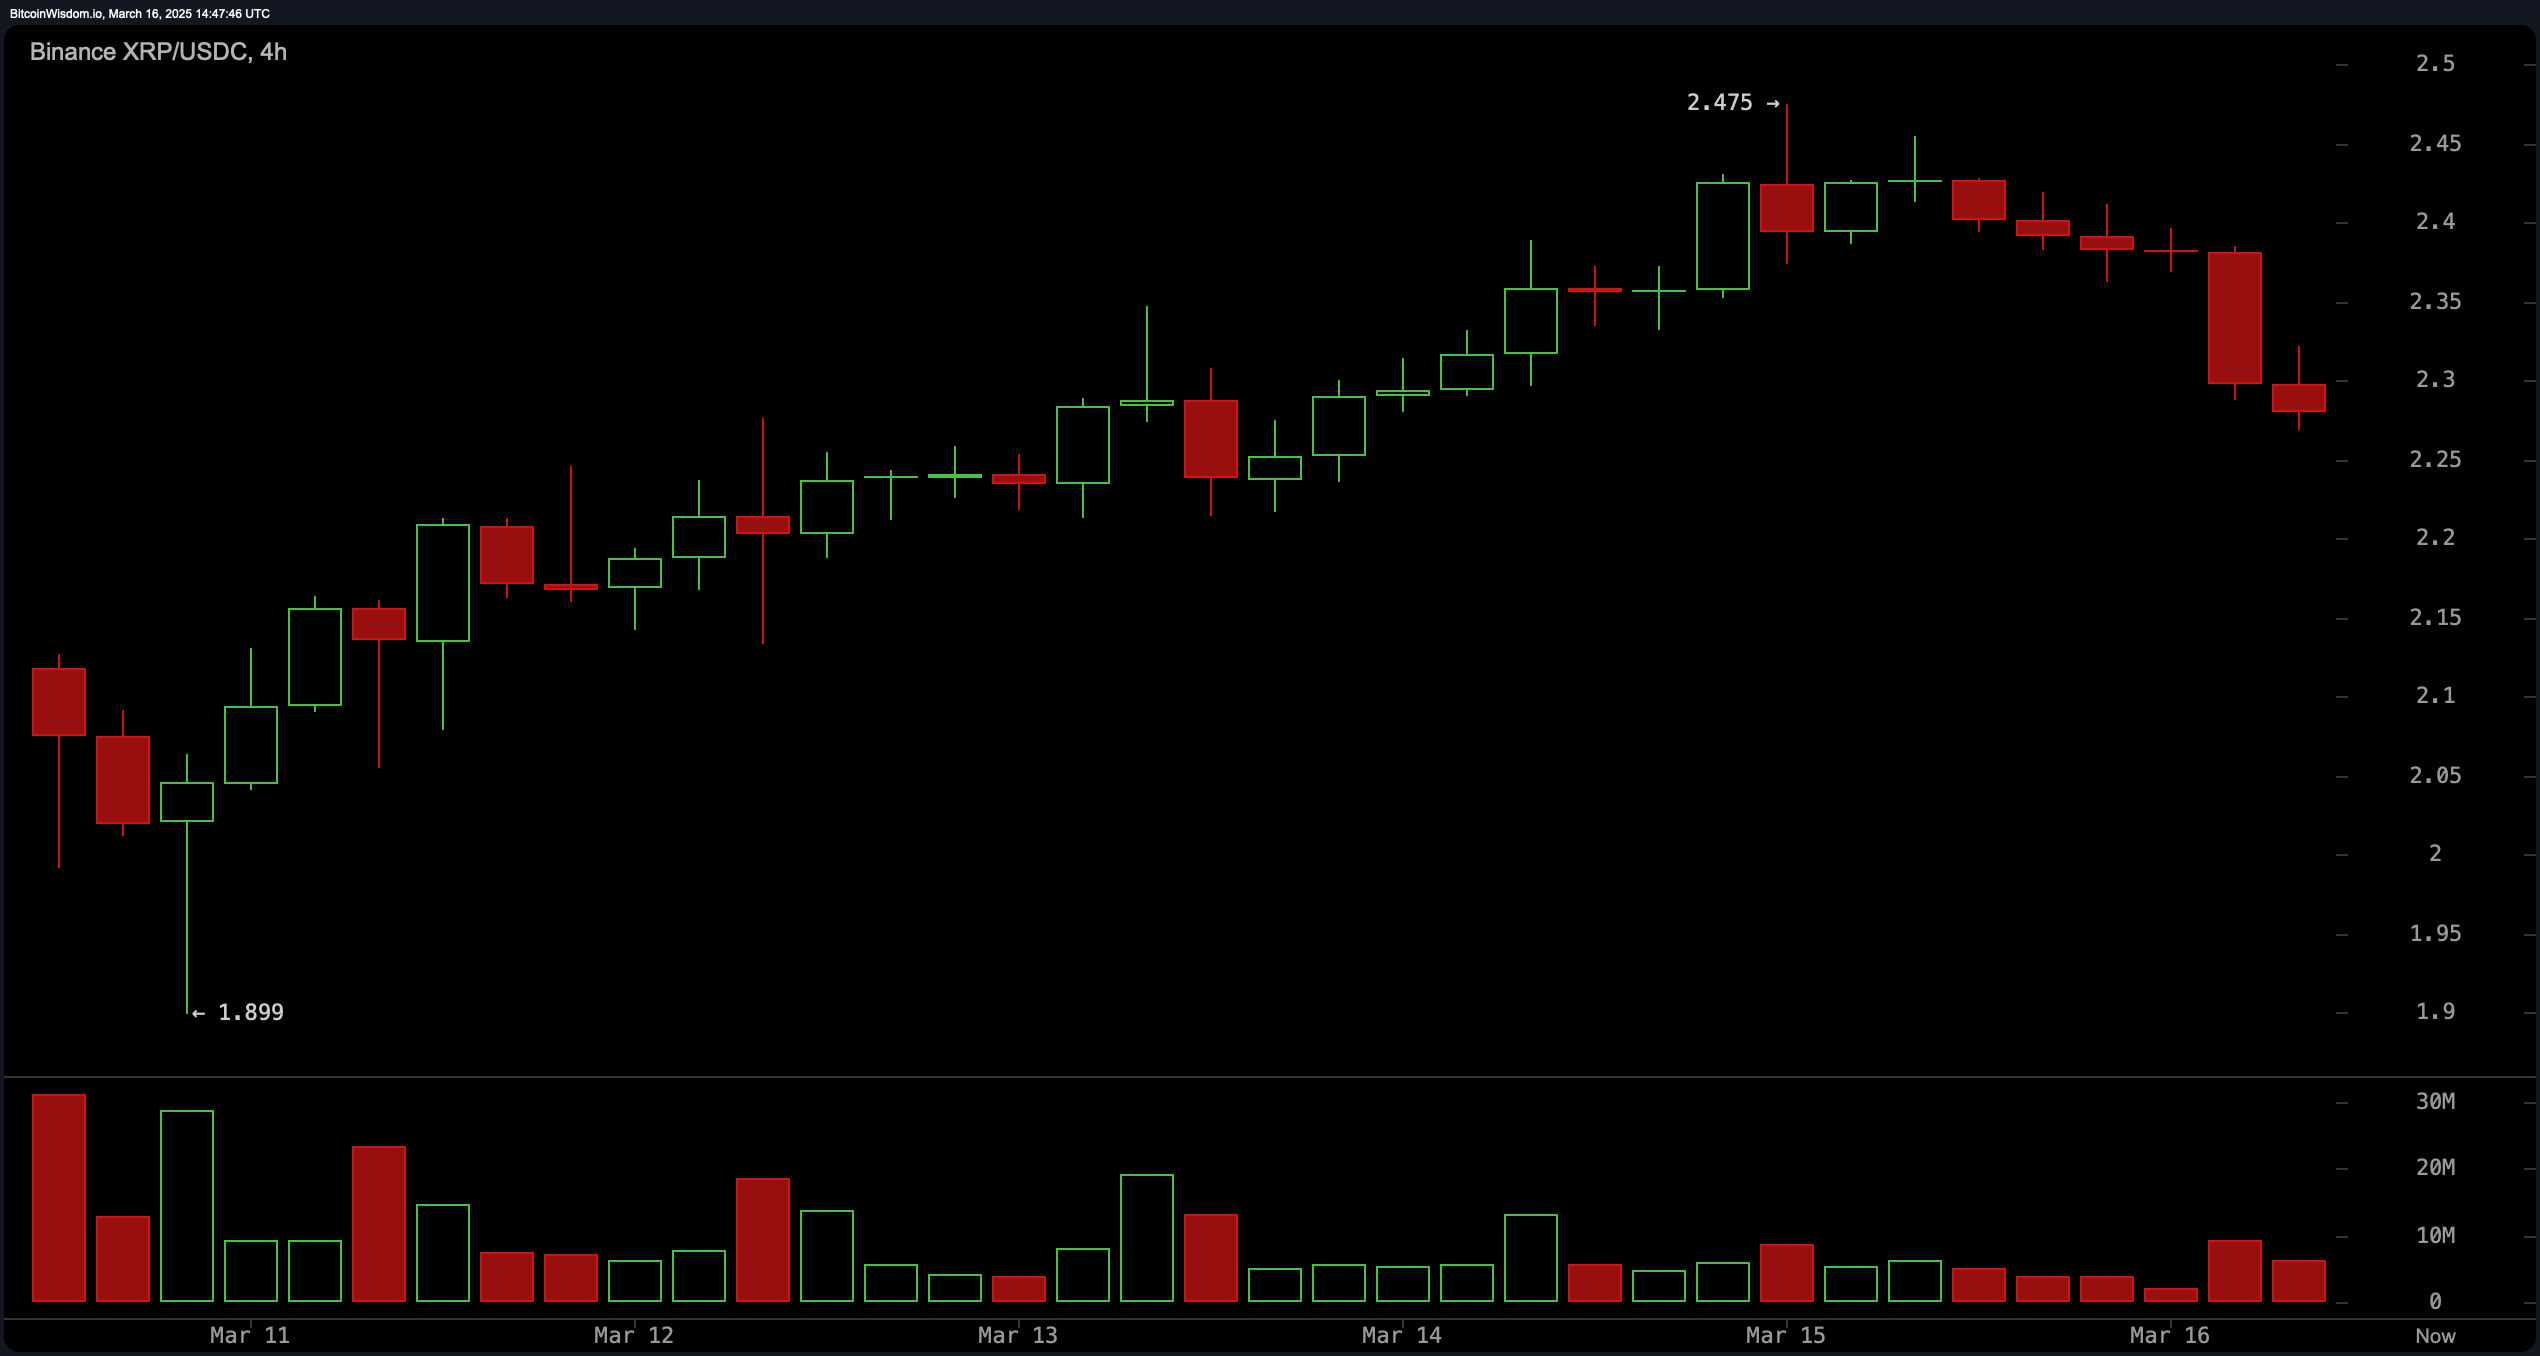
Examining the 4-hour chart, XRP demonstrates a gradual upward trend from its recent low of $2.17. The ascending channel formation indicates a potential bullish continuation if the price sustains above the lower trendline support. The RSI on this timeframe is positioned at approximately 55, suggesting mild bullish momentum without reaching overbought territory. The MACD shows a slight divergence above the signal line, reinforcing the possibility of continued upward movement.
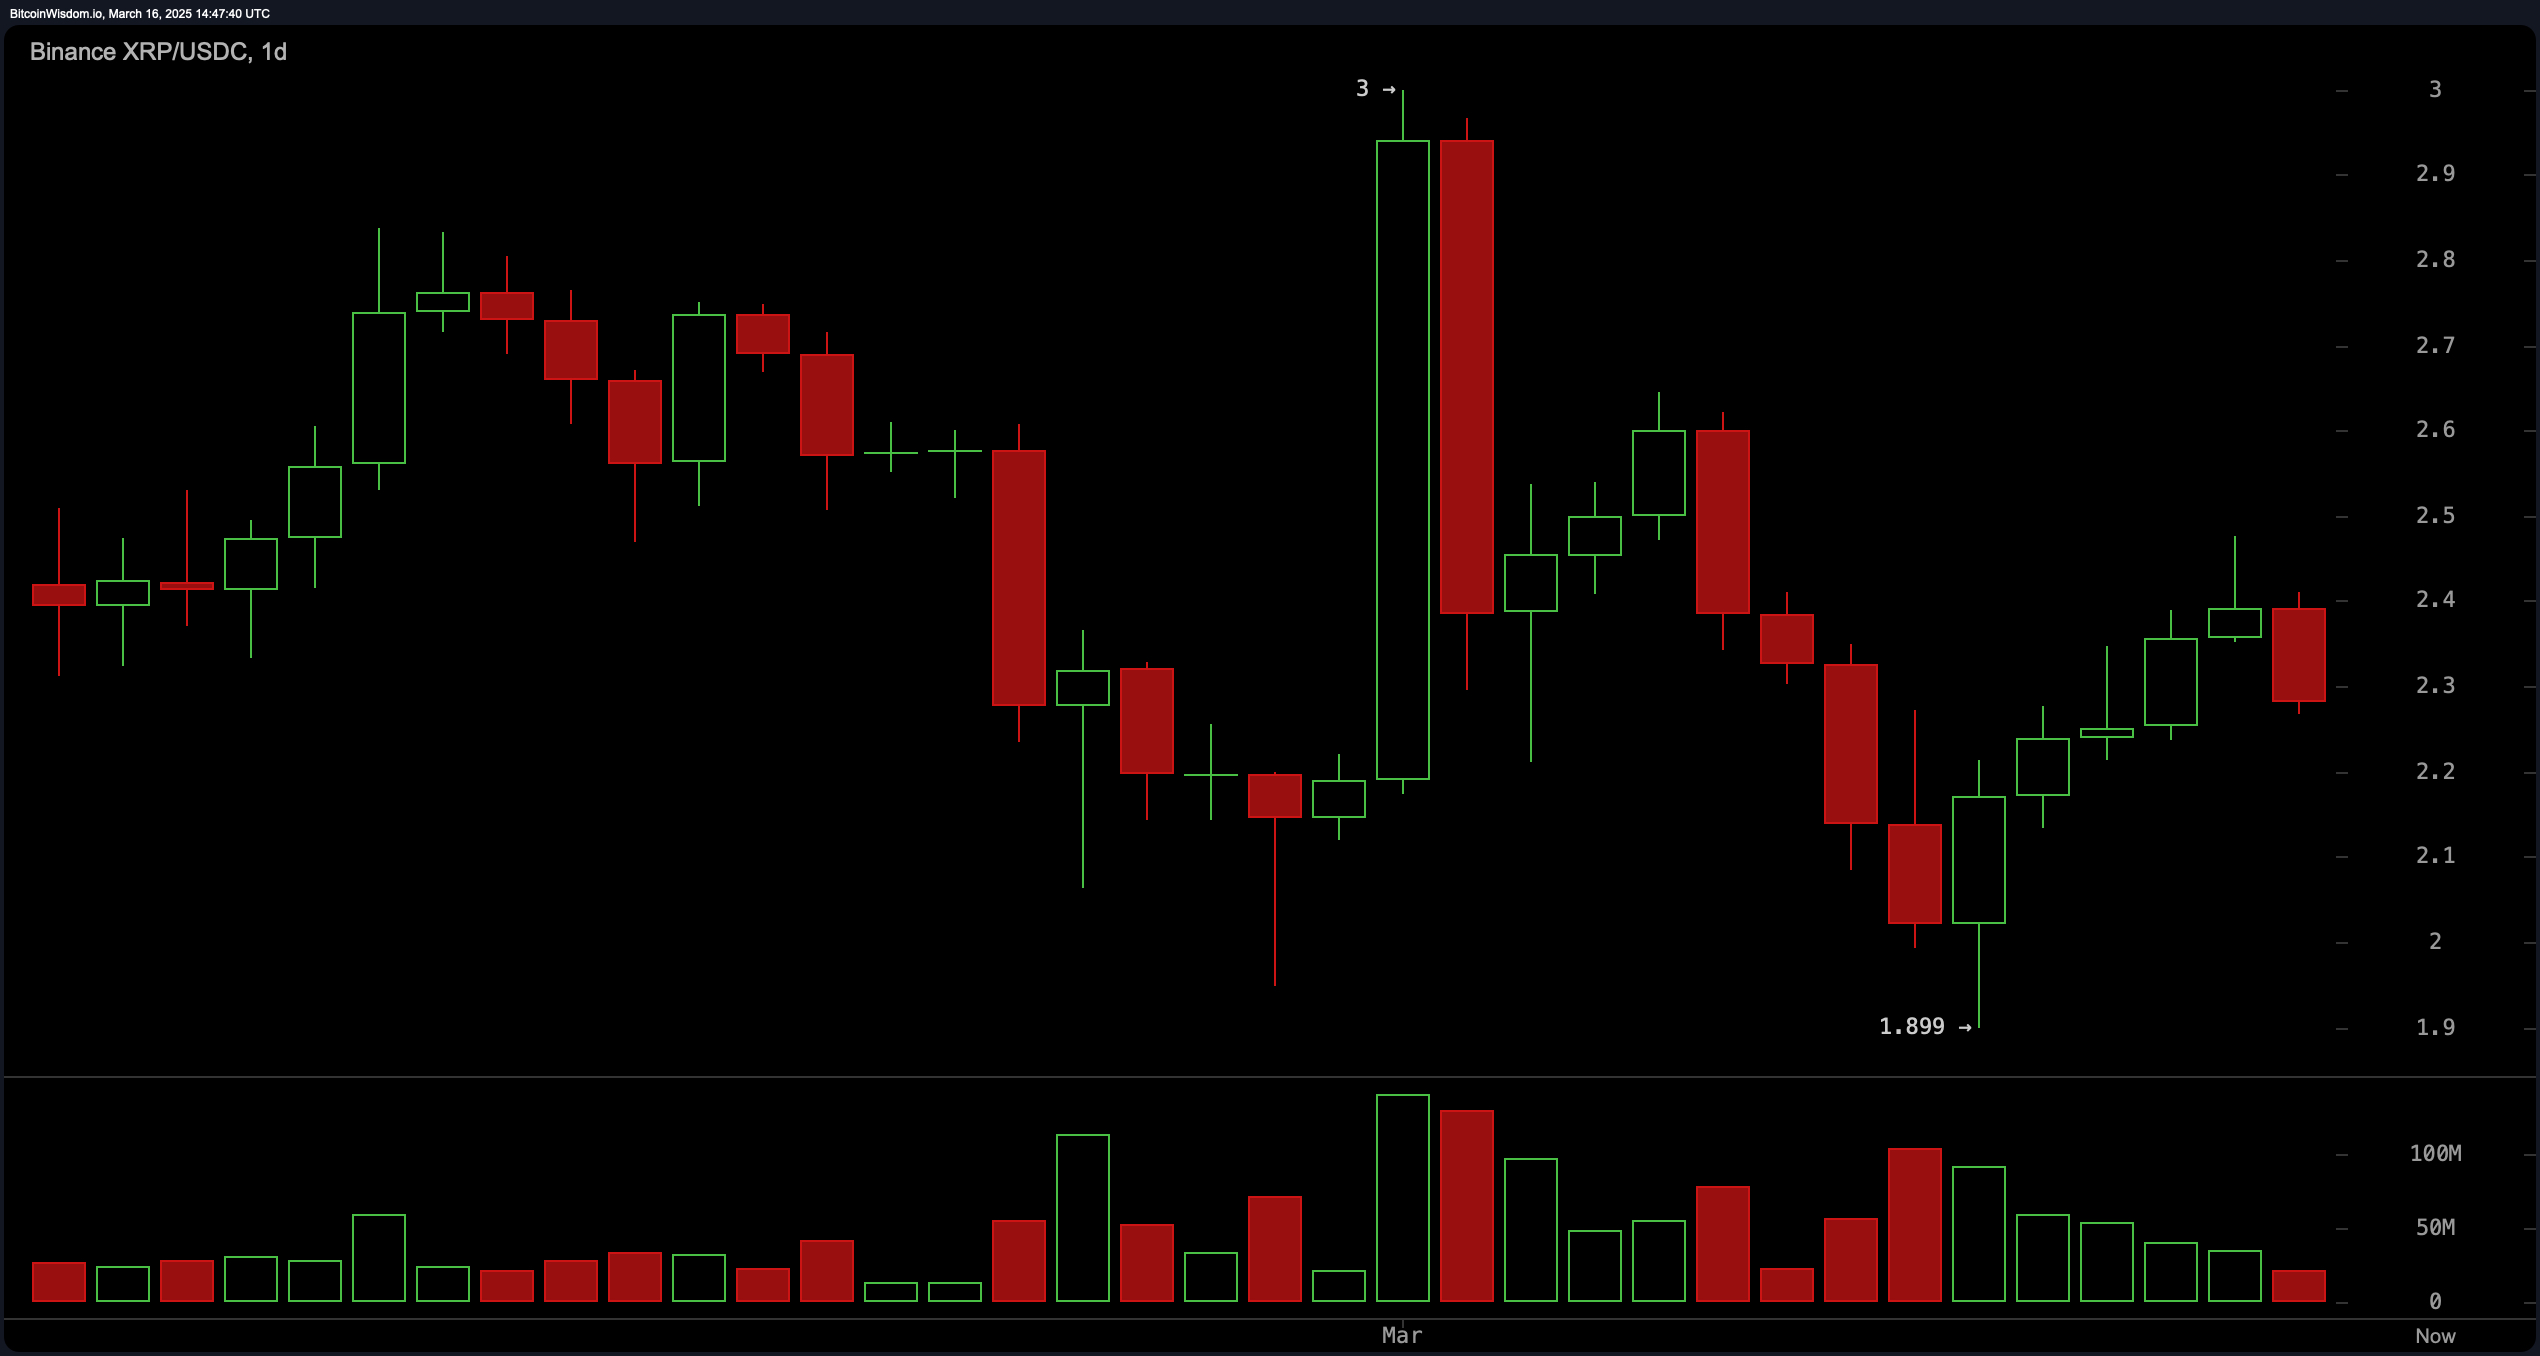
On the daily chart, XRP’s price action reflects a broader consolidation phase following its peak at $3.40. The current price level near $2.28 aligns with a significant support zone, previously acting as resistance during earlier price rallies. The RSI on the daily timeframe resides around 48, indicating a neutral stance with potential for future directional moves. The MACD remains above the zero line but exhibits a narrowing histogram, suggesting diminishing bullish momentum and the need for caution.
In terms of oscillators, the Stochastic oscillator reveals a %K line crossing above the %D line on both the 4-hour and daily charts, hinting at potential bullish reversals from oversold conditions. The average directional index (ADX) registers below 25 across multiple timeframes, indicating a weak trend strength and the likelihood of continued sideways movement until a decisive breakout occurs.
Regarding moving averages (MAs), the 50-period simple moving average (SMA) on the 4-hour chart has recently crossed above the 200-period SMA, forming a bullish golden cross pattern. This crossover often signifies a potential shift towards upward momentum. On the daily chart, however, the 50-day SMA remains below the 200-day SMA, reflecting a longer-term bearish outlook that requires further validation through sustained price appreciation.
In summary, XRP’s technical indicators present a mixed picture, with short-term bullish signals tempered by longer-term uncertainties. Traders should monitor key support and resistance levels, alongside oscillator readings and moving average crossovers, to gauge potential price movements in the coming sessions.
Bull Verdict:
XRP’s technical indicators suggest the potential for a bullish breakout if the price holds above key support levels. The bullish crossover of the 50-period simple moving average (SMA) over the 200-period SMA on the 4-hour chart, combined with improving momentum on oscillators like the stochastic oscillator, indicates growing buying interest. If volume supports an upward move, XRP could challenge resistance levels near $2.50 and potentially aim for higher targets in the short term.
Bear Verdict:
Despite short-term bullish signals, XRP remains below its 200-day simple moving average (SMA) on the daily chart, signaling a longer-term bearish trend. The moving average convergence divergence (MACD) is showing weakening momentum, and the average directional index (ADX) indicates a lack of strong trend strength. If support at $2.28 fails to hold, XRP could retest lower levels near $2.15 or even $2.00, extending its corrective phase.