There are times when price moves on the crypto market seem to follow a predictable path, respecting key levels and playing within the boundaries of well-established indicators. Then there are moments when a coin like Shiba Inu ($SHIB) appears to be winding up for something bigger, something that could potentially shift its trajectory big time.
Right now, $SHIB is hovering on the edge of what looks like a breakout, and one of the most widely followed technical indicators - the Bollinger Bands - is signaling that a 63% move could be on the horizon.
A quick look at $SHIB’s price action over the past week shows that the token recently touched the lower Bollinger Band near $0.00001. Typically, when an asset hits this lower boundary, traders see it as an indication that the price is either oversold or approaching a level where a reversal is likely.
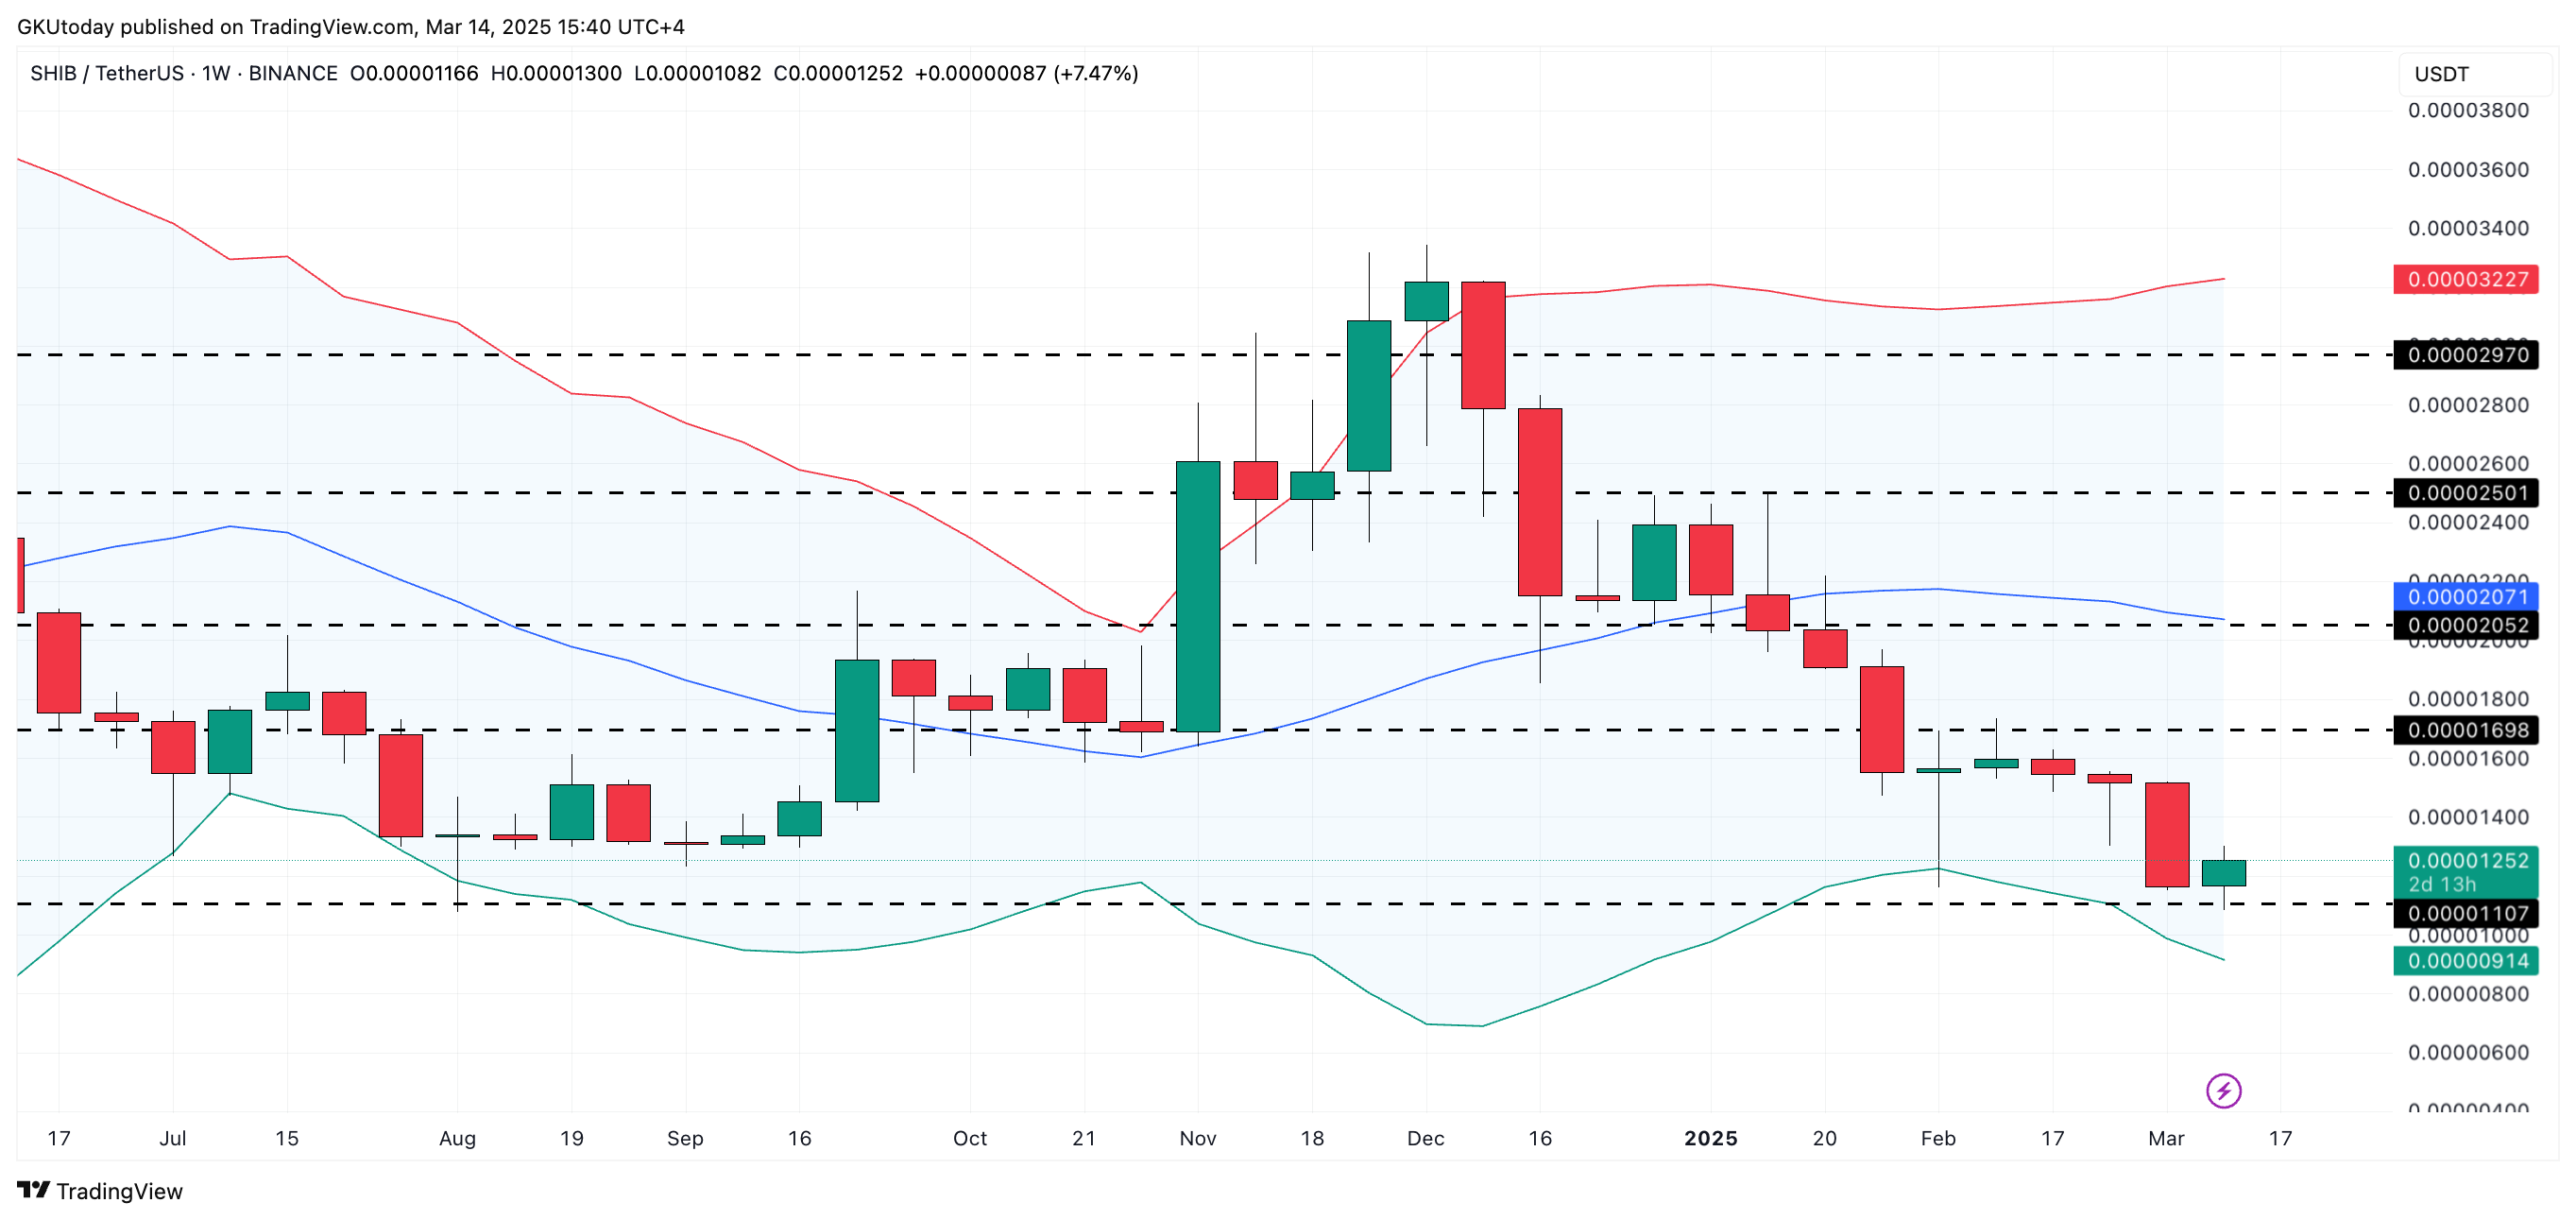
That is exactly what happened - $SHIB bounced back, gaining 8% in the last five days. Now, the next point of interest becomes the middle band, sitting at $0.0000205, which also happens to be a strong resistance level.
If $SHIB manages to push toward this level, it could represent a 63% gain from the recent low.
Bollinger Bands are often used as a guide rather than a definitive prediction tool, but in cases like this - where the price interacts with a key level and then reacts with strong momentum - the indicator becomes especially relevant. It frames the possibilities and outlines the potential trajectory.
In this case, it raises the question: will $SHIB maintain this move and break past its next resistance, or will it stop before reaching that point?
For now, the market remains in wait-and-see mode, but with $SHIB showing early signs of a recovery phase, the current setup makes $SHIB one of the more interesting assets to monitor in the short term.