
Avalanche ($AVAX) has been on a rough ride lately, facing persistent bearish pressure that has driven its price lower. Once a strong performer in the altcoin space, $AVAX price has struggled to regain its momentum after a series of declines. Investors are now questioning whether the current price action signals a potential reversal or if further downside is on the horizon.
With the price hovering around $18.70, traders are closely watching key support and resistance levels. The technical indicators, including the RSI, MACD, and candlestick formations, provide valuable insights into what might come next for $AVAX price. Is this a prime buying opportunity, or should investors brace for more losses? Let’s dive into the analysis.
$AVAX Price Prediction: Is $AVAX Finding a Bottom After Continuous Decline?
 $AVAX Price Prediction">
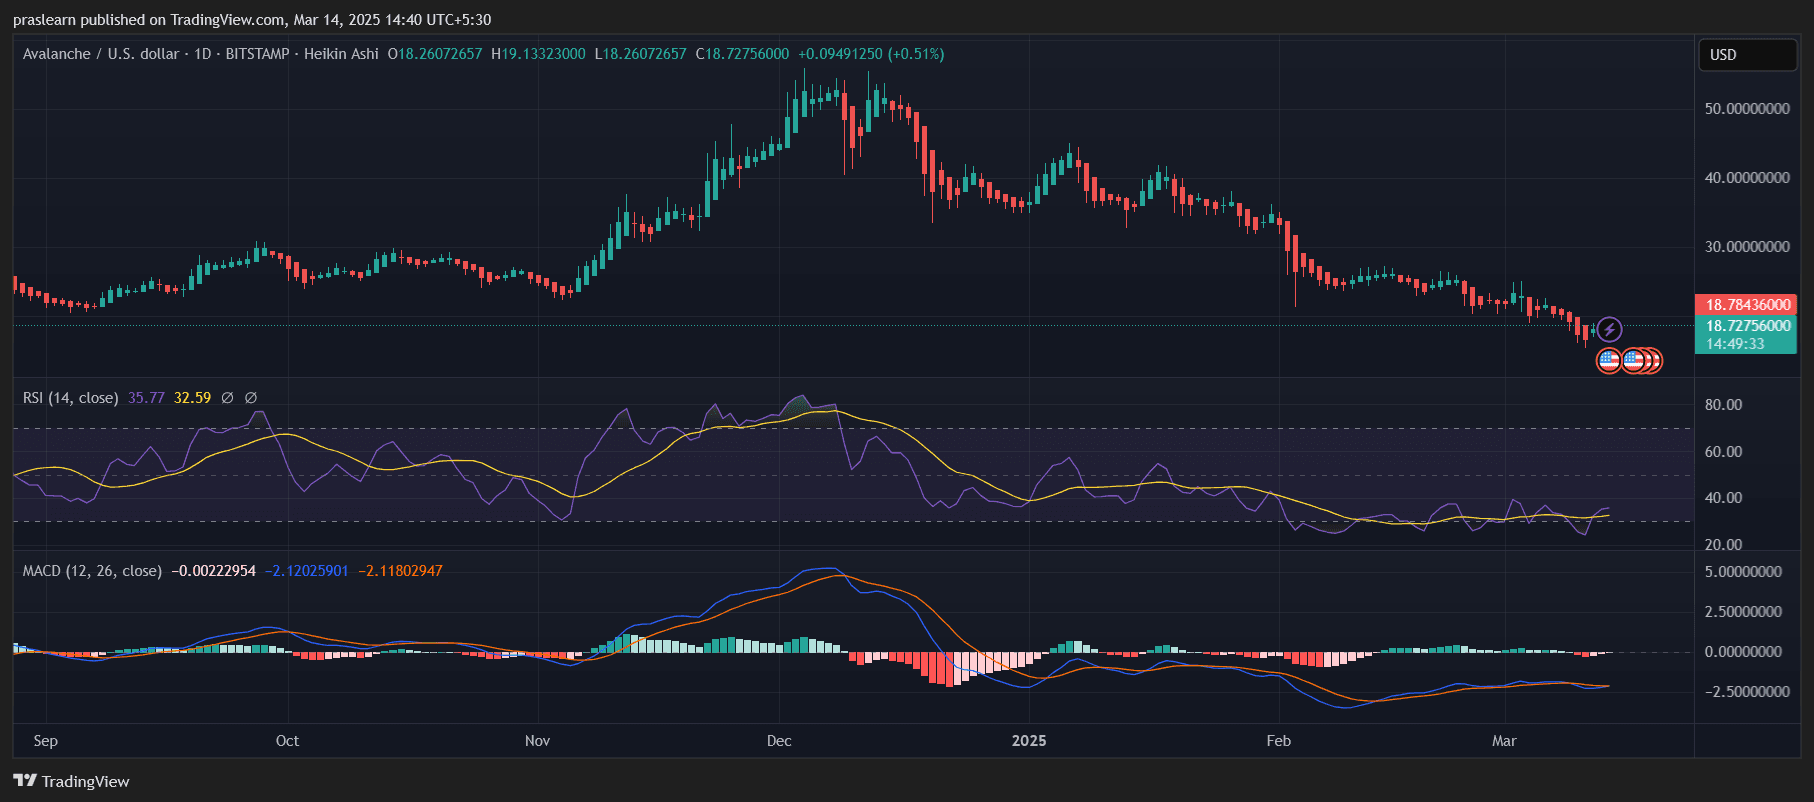
Avalanche ($AVAX) has been on a prolonged downward trend, with its price struggling to find solid support. The latest daily chart indicates that $AVAX is hovering near the $18.70 level after a significant sell-off. The price action suggests bearish dominance, but is there a chance of a rebound?
One key observation is the candlestick formation on the Heikin Ashi chart. The red candles have been persistent, signaling a continuation of the bearish momentum. However, the appearance of small-bodied candles with wicks suggests potential indecision among traders, which could be an early sign of a reversal attempt.
Is the RSI Showing Oversold Conditions?
The Relative Strength Index (RSI) is currently at 35.77, hovering near the oversold zone but not yet confirming a complete reversal. Generally, RSI below 30 is considered oversold, which often triggers buying interest. While $AVAX is approaching this level, it hasn’t fully reached an extreme low that would typically indicate a strong buying opportunity.
Additionally, the RSI moving below the signal line confirms that momentum is still weak. A decisive push above 40 on the RSI could strengthen the bullish argument, but as of now, the bearish sentiment remains dominant.
What Does the MACD Say About $AVAX's Next Move?
The MACD (Moving Average Convergence Divergence) indicator is another crucial tool in analyzing $AVAX’s price trend. The MACD histogram is slightly improving, but it remains below the zero line, which confirms that bearish pressure is still present.
The MACD line is at -2.12, barely attempting to cross above the signal line (-2.11). A bullish crossover of these lines would be a strong reversal signal, but until that happens, the possibility of further downside remains on the table.
Where Is the Key Support and Resistance for $AVAX?
$AVAX is currently testing an important support zone around $18.50-$18.70. If this level holds, there is a chance for a relief bounce, potentially pushing the price toward $20.50-$21.00, where the next resistance lies.
On the downside, if sellers break below $18.50, $AVAX could slide further towards $16.80, which is the next major support level based on historical price action. A break below this could trigger further panic selling.
$AVAX Price Prediction: Will $AVAX Rebound or Face More Downside?
The current indicators suggest that $AVAX is still in a bearish phase, but some signs of potential stabilization are emerging. If $AVAX holds above $18.50 and buyers step in, we could see a short-term recovery. However, for a strong bullish reversal, the price must reclaim $21.00 and sustain above it.
On the other hand, if selling pressure continues and the price fails to hold the $18.50 support, further declines towards $16.80 or even $15.00 could be expected.