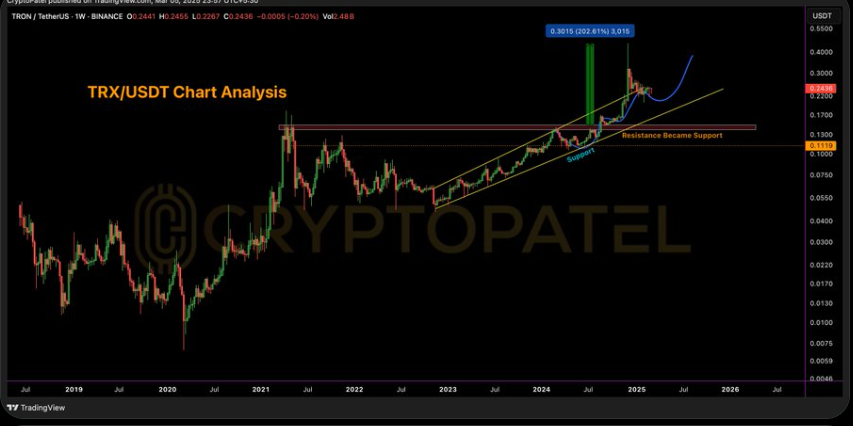
Tron Price Chart Source: X
In addition, the analyst examined historical data to discover substantial price surges in $TRX, which achieved increases exceeding 200-300% during specific periods. $TRX price delivered significant gains between October and November 2024 at its initial price of $0.16.
The price reached $0.426 in December 2024 following the mentioned period. Market experts project additional growth potential in $TRX because of favorable market trends identified after its recent rally.
TRON Network Activity Hits a Two-Month High
Crypto analyst Ali Martinez noted that network activity on the Tron platform experienced substantial growth as 2.94 million active addresses were registered on March 4, 2025.
TRON Network recently recorded its highest number of active addresses in two months. That indicates growing attention towards this blockchain platform.
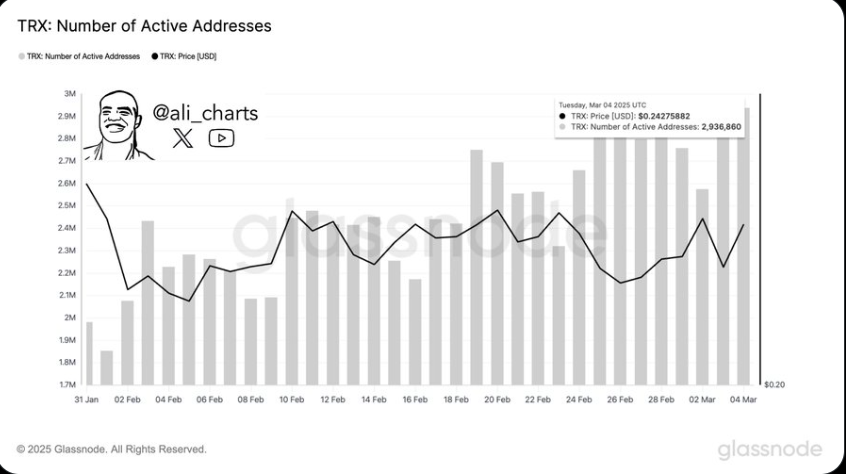
Tron Network Activity Source: X
Blockchain network health and usage levels often depend on active addresses because these new users demonstrate blockchain participation. The analyst notes that this rise in activity functions as an important element backing up favorable $TRX market predictions.
$TRX Price Action and Prediction
The current trading value of Tron price hovers at $0.2458 while showing a 2% uptick from the past 24 hours. $TRX coin exhibited volatility during the day, with prices ranging from $0.2407 to $0.2465.
The analysis indicates a continuous bullish price pattern as $TRX demonstrates stable support at the $0.240 price level. For many traders, this price action is viewed as an indication of strength, with the coin poised for potential growth in the coming weeks.
On the technical indicators, Tron price demonstrates buying power dominance over selling pressure through its Bull Bear Power (BBP) analysis. It reports a positive value of 0.0105.
Market sentiment shows a minimal bullish bias with the green bars appearing in the BBP histogram. The current buying power lacks sufficient strength to produce significant market gains because the market remains in consolidation mode.
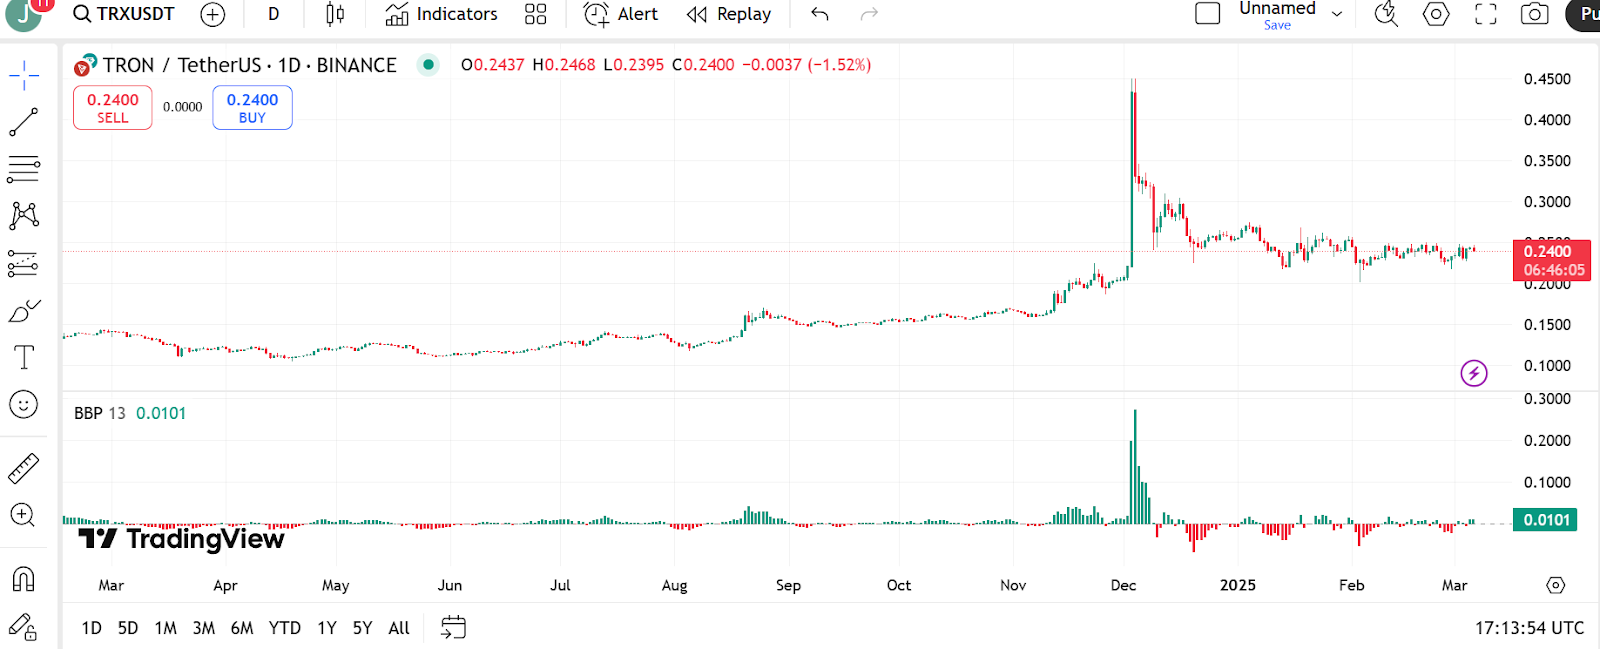
Tron Price Chart Source: TradingView
Additionally, Tron stands at the lower edge of Bollinger Bands, which reveals the market exhibits lesser volatility right now. The tight bands indicate an ongoing phase of market stabilization.
Market conditions indicate an upcoming rise when the price moves above the middle band. Yet, potential weakness appears after Tron price crosses below the lower band.

 thecoinrepublic.com