The 4-hour chart presents a broader view of the recent uptrend, with $XRP attempting to sustain momentum above key support levels. The $2.5 to $2.6 zone remains a crucial area for buyers, as breaking below this level could expose the price to a test of $2.4 or lower. Conversely, should $XRP maintain its position above $2.6, an upward push toward $2.9 to $3.0 is possible, with the next resistance level beyond that situated at $3.4. Market sentiment remains cautiously bullish, with traders monitoring whether price consolidation will lead to another breakout.
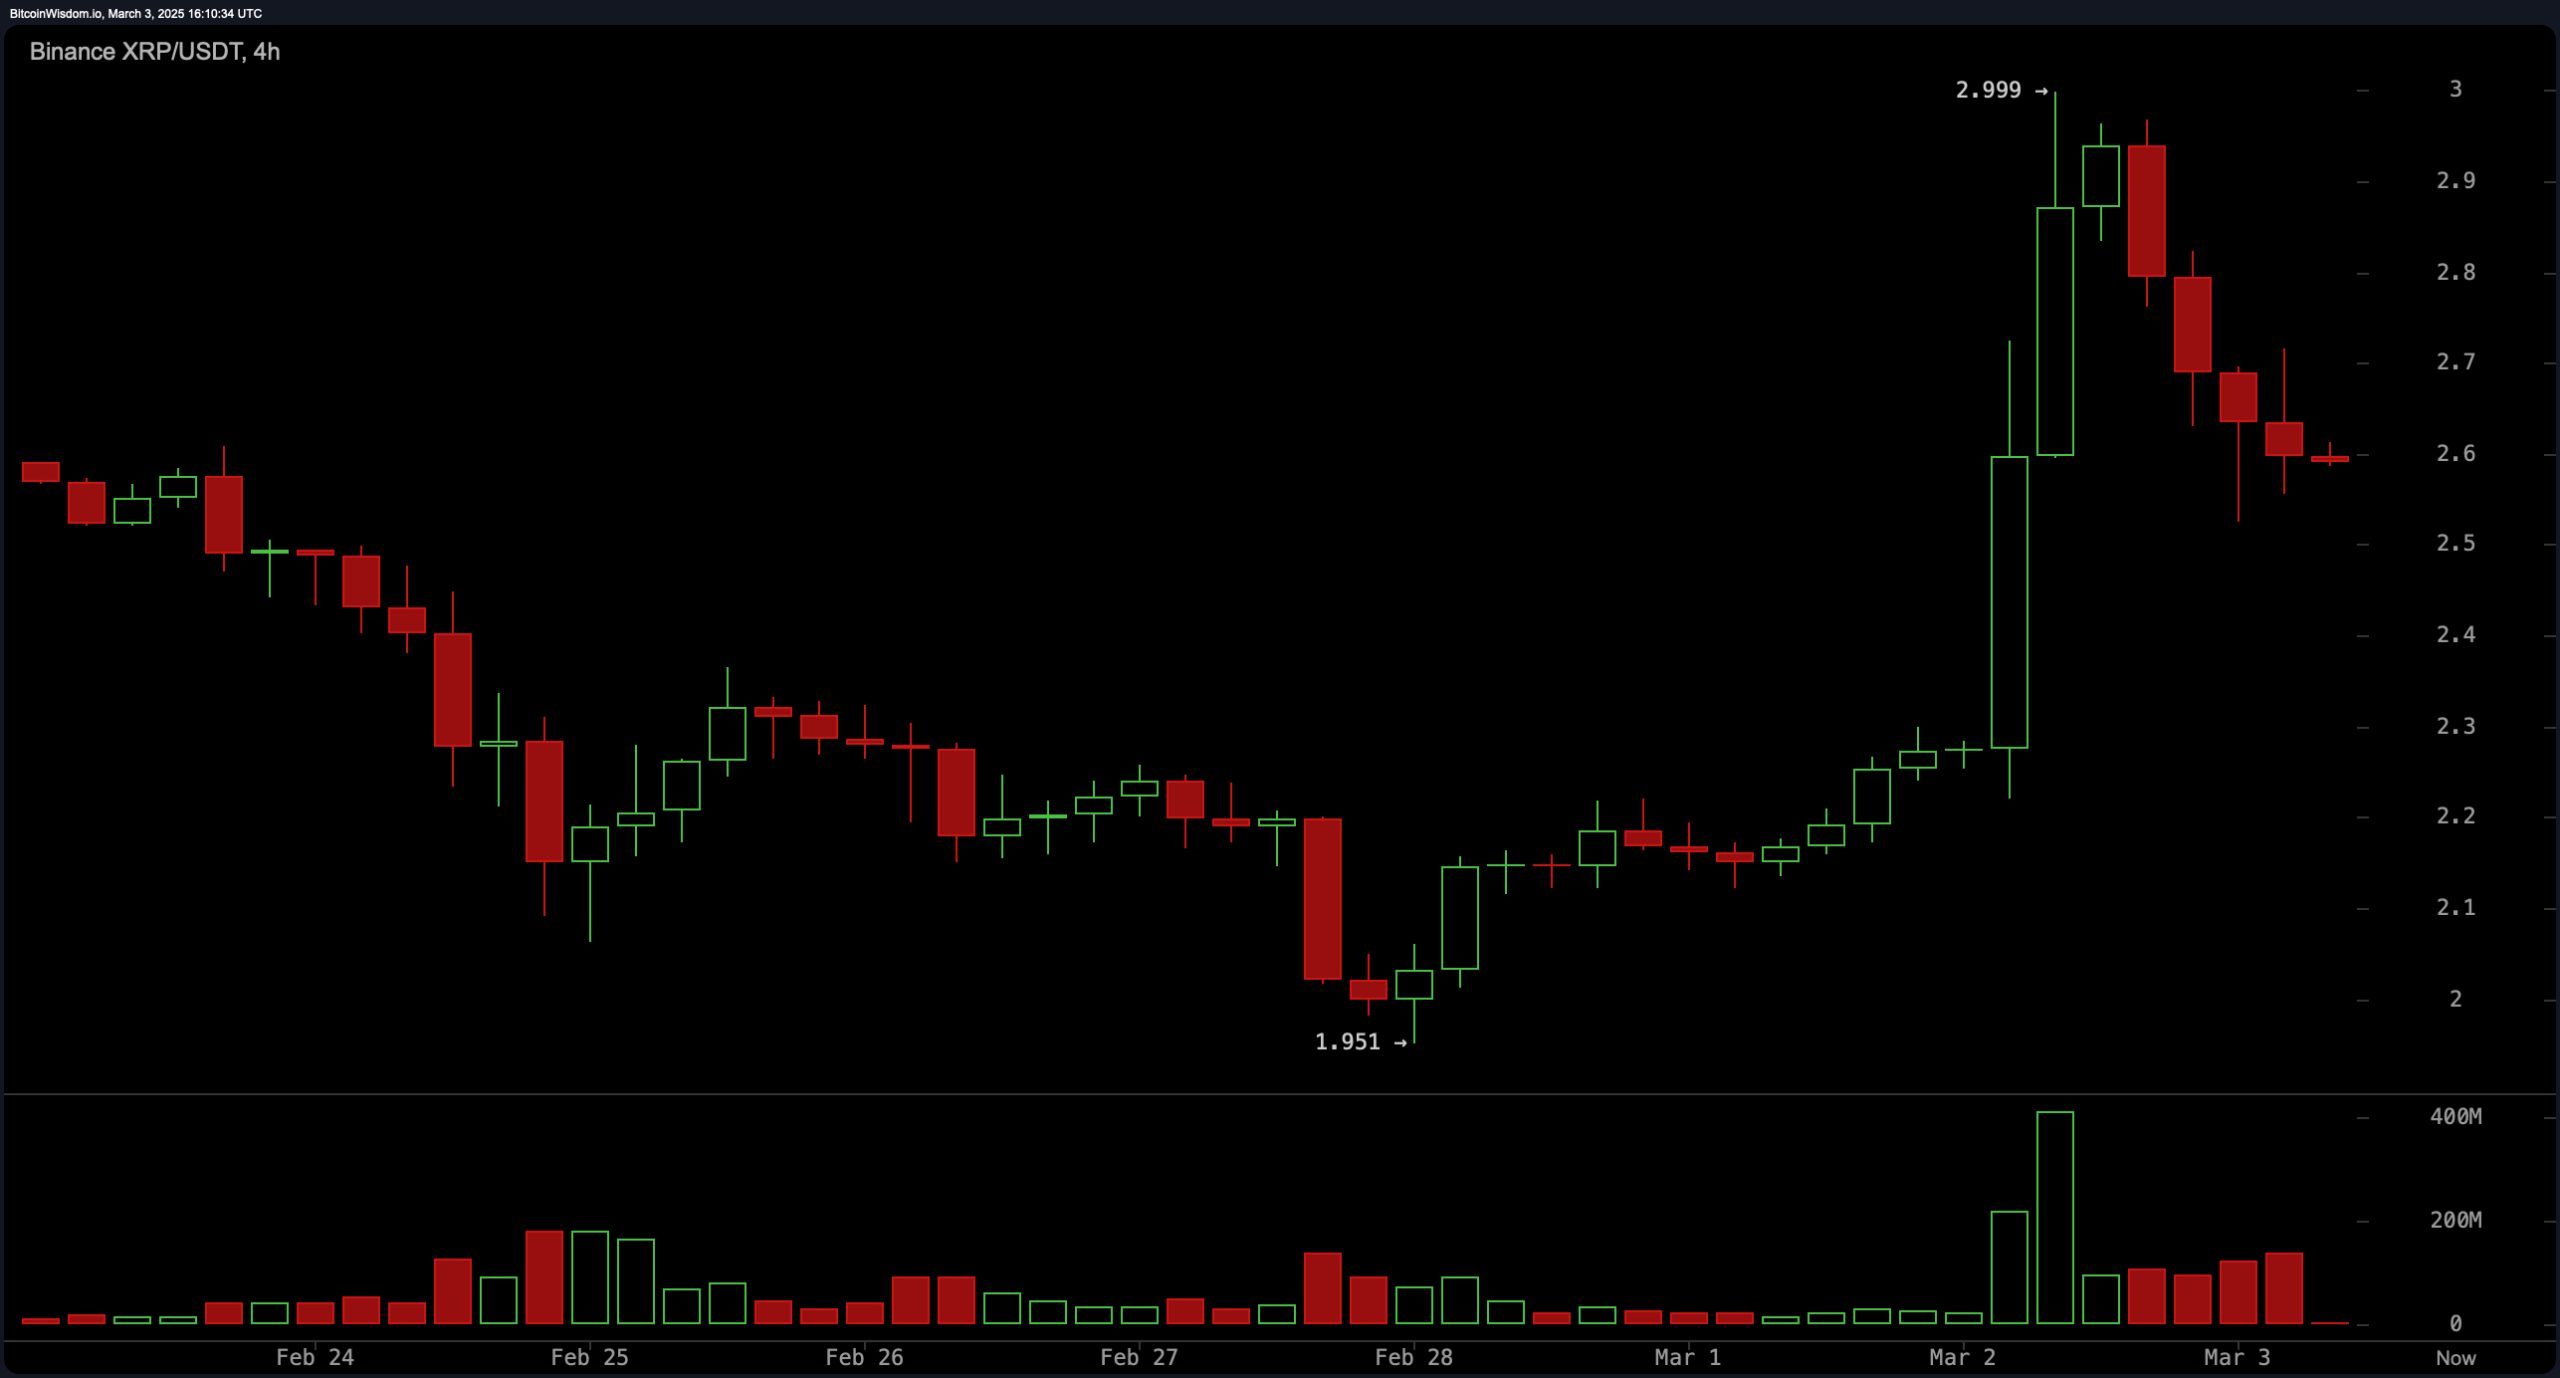
$XRP/$USDT via Binance 4H chart on March 3, 2025.
On the daily chart, $XRP’s trend remains positive despite short-term consolidation. The price has recovered from recent lows and continues to trade above key moving averages, which supports the bullish outlook. A decisive close above $3.0 could propel $XRP toward the $3.4 to $3.5 range, while failure to hold above $2.5 may lead to a retest of $2.2. The ongoing battle between buyers and sellers will determine the direction of the next major move.
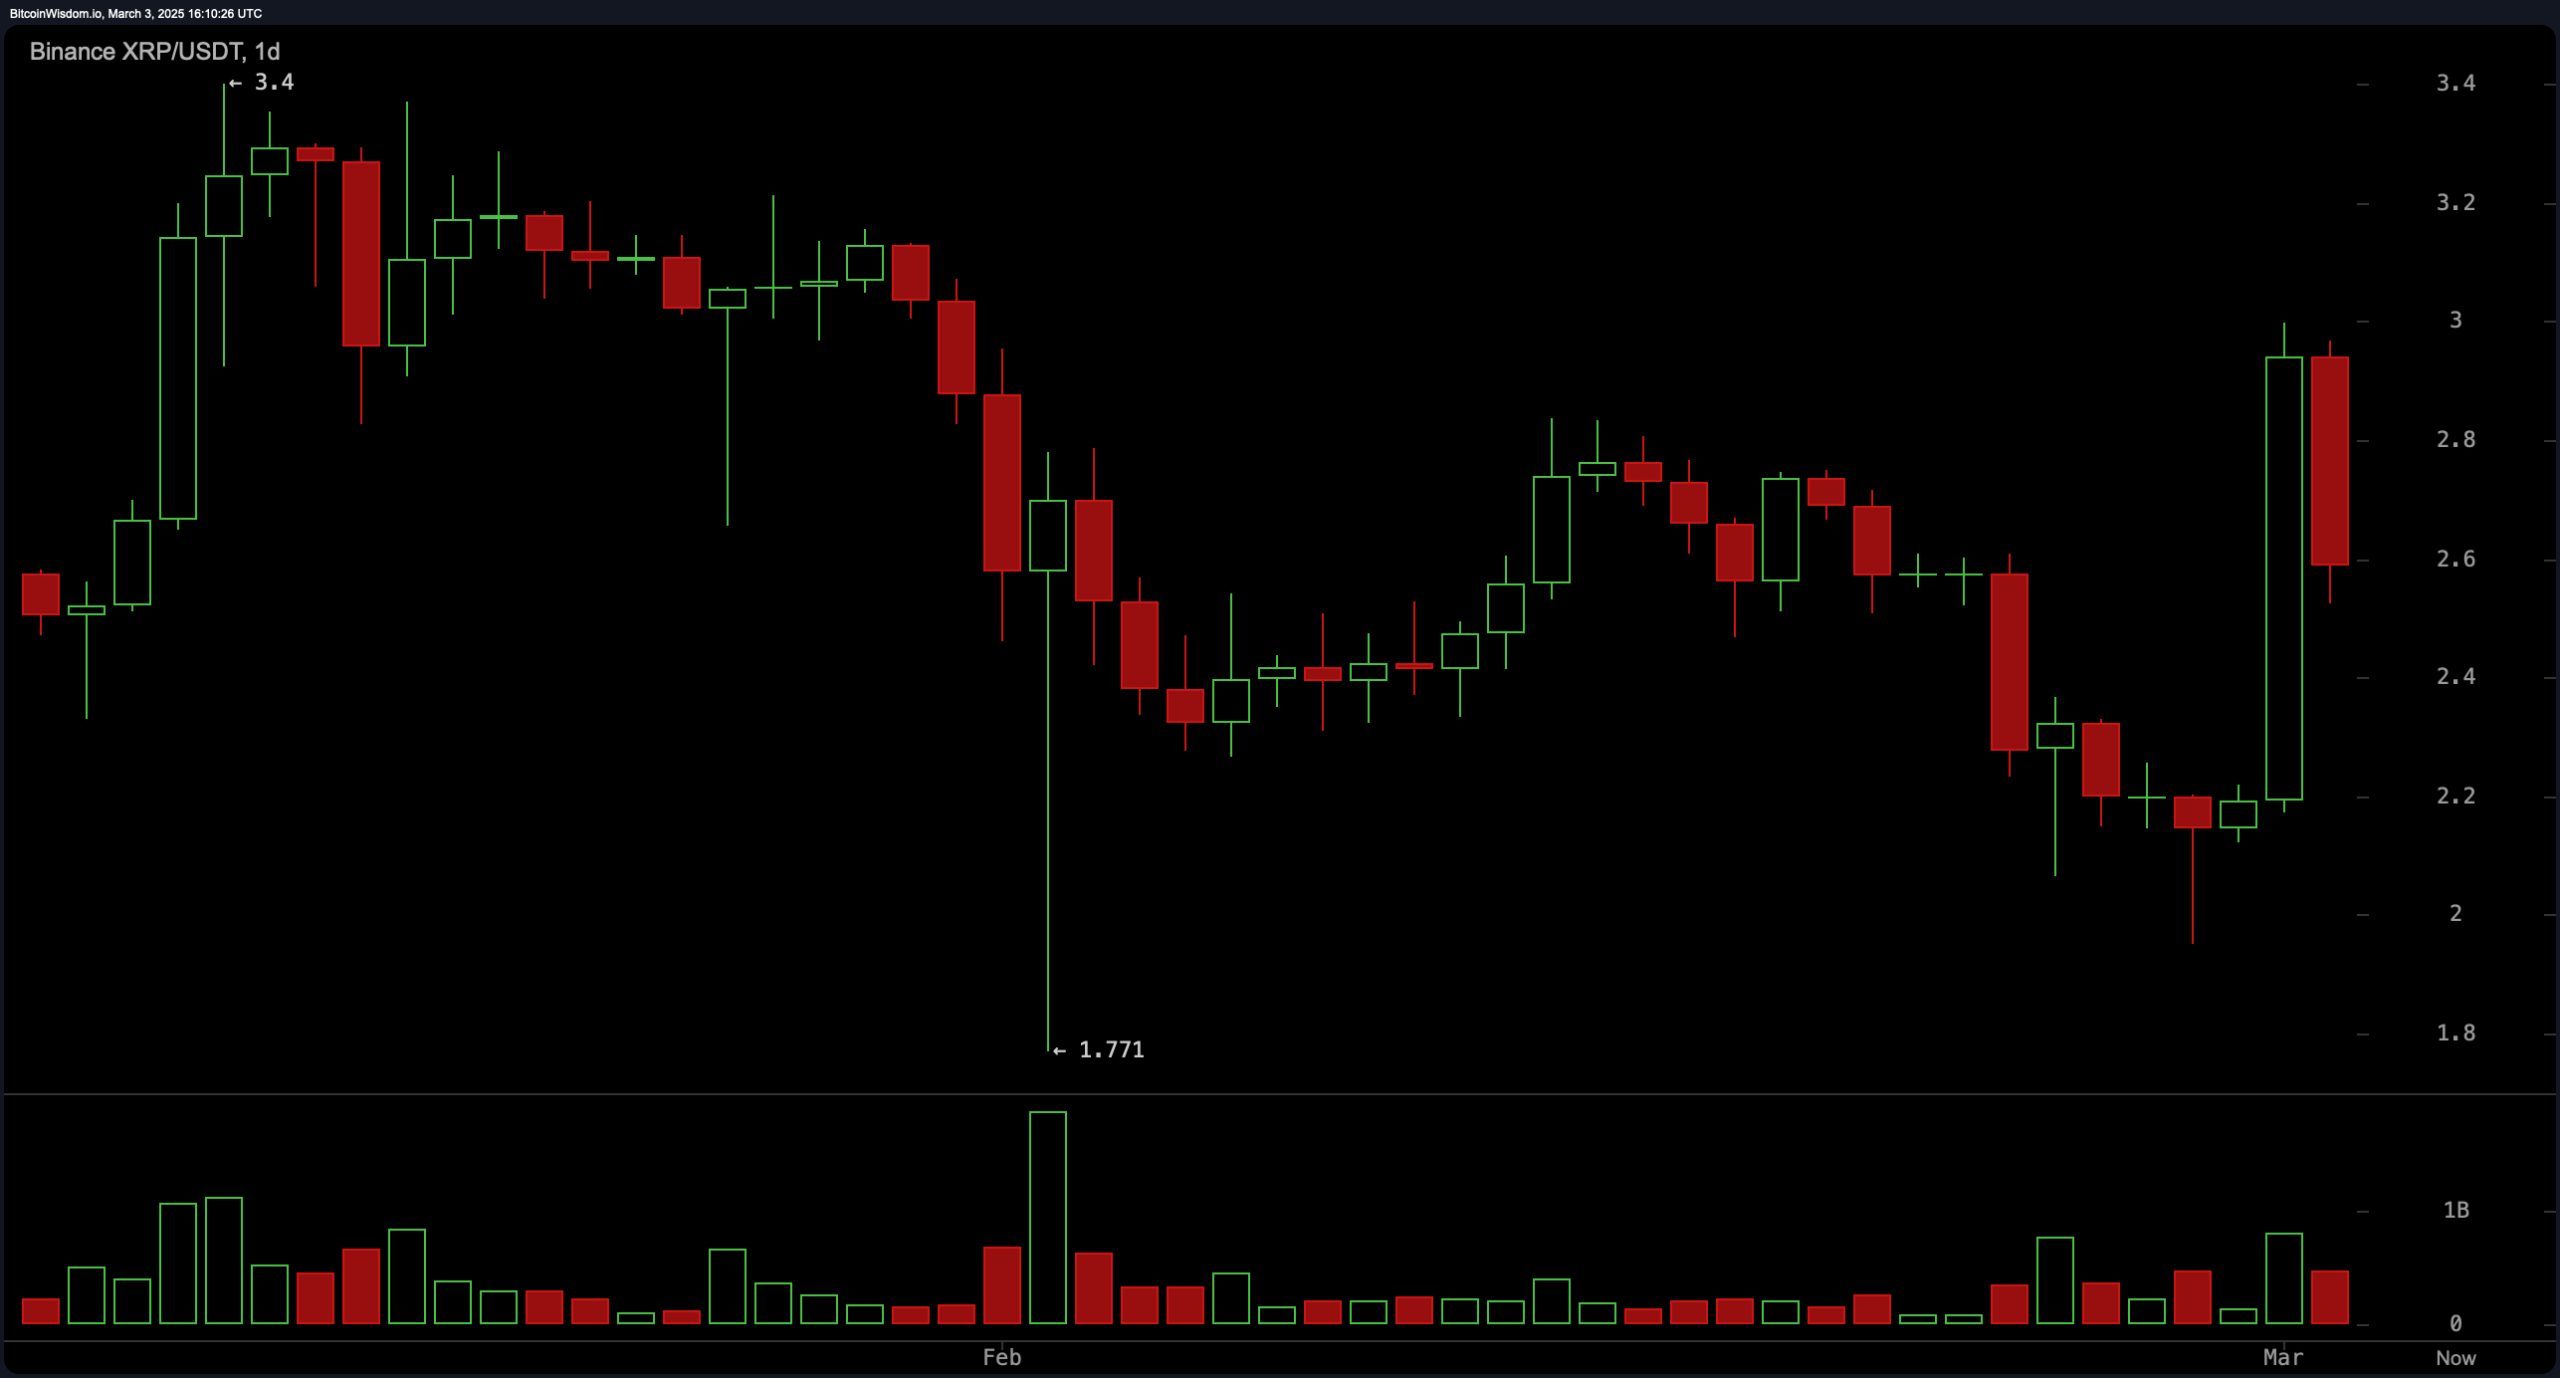
$XRP/$USDT via Binance 1D chart on March 3, 2025.
Oscillators reflect a largely neutral market, with the relative strength index (RSI) at 51.99 and the Stochastic at 60.04, both indicating equilibrium. The commodity channel index (CCI) sits at 67.11, while the average directional index (ADX) at 33.93 suggests a moderate trend strength. The awesome oscillator is slightly negative at -0.19, reinforcing the idea of short-term indecision. Momentum at 0.03 leans bearish, while the moving average convergence divergence (MACD) level at -0.05 signals a buy, suggesting that further upside potential exists if momentum strengthens.
Moving averages (MAs) continue to favor an upward trend, with most shorter-term indicators showing positive signals. The exponential moving averages (EMA) for 10, 20, 30, 50, 100, and 200 periods all indicate buying pressure, reinforcing support levels. The simple moving averages (SMA) for 10, 20, 30, 100, and 200 periods are also in bullish territory, with only the 50-period SMA showing a bearish signal at 2.72. The alignment of these indicators suggests that as long as $XRP maintains support above the shorter-term moving averages, the broader uptrend remains intact.
Bull Verdict:
$XRP remains in a strong uptrend despite short-term consolidation, with buying pressure evident in key moving averages. If the price holds above $2.5 and breaks through $3.0, a rally toward $3.4 or higher is likely. With momentum indicators showing potential for further gains, $XRP could see continued bullish momentum in the coming days.
Bear Verdict:
While $XRP has experienced a strong rally, declining volume and neutral oscillators suggest weakening momentum. A break below $2.5 could trigger further downside toward $2.2 or lower, with selling pressure increasing if key support levels fail. Until a decisive move above $3.0 occurs, the risk of further retracement remains.

 news.bitcoin.com