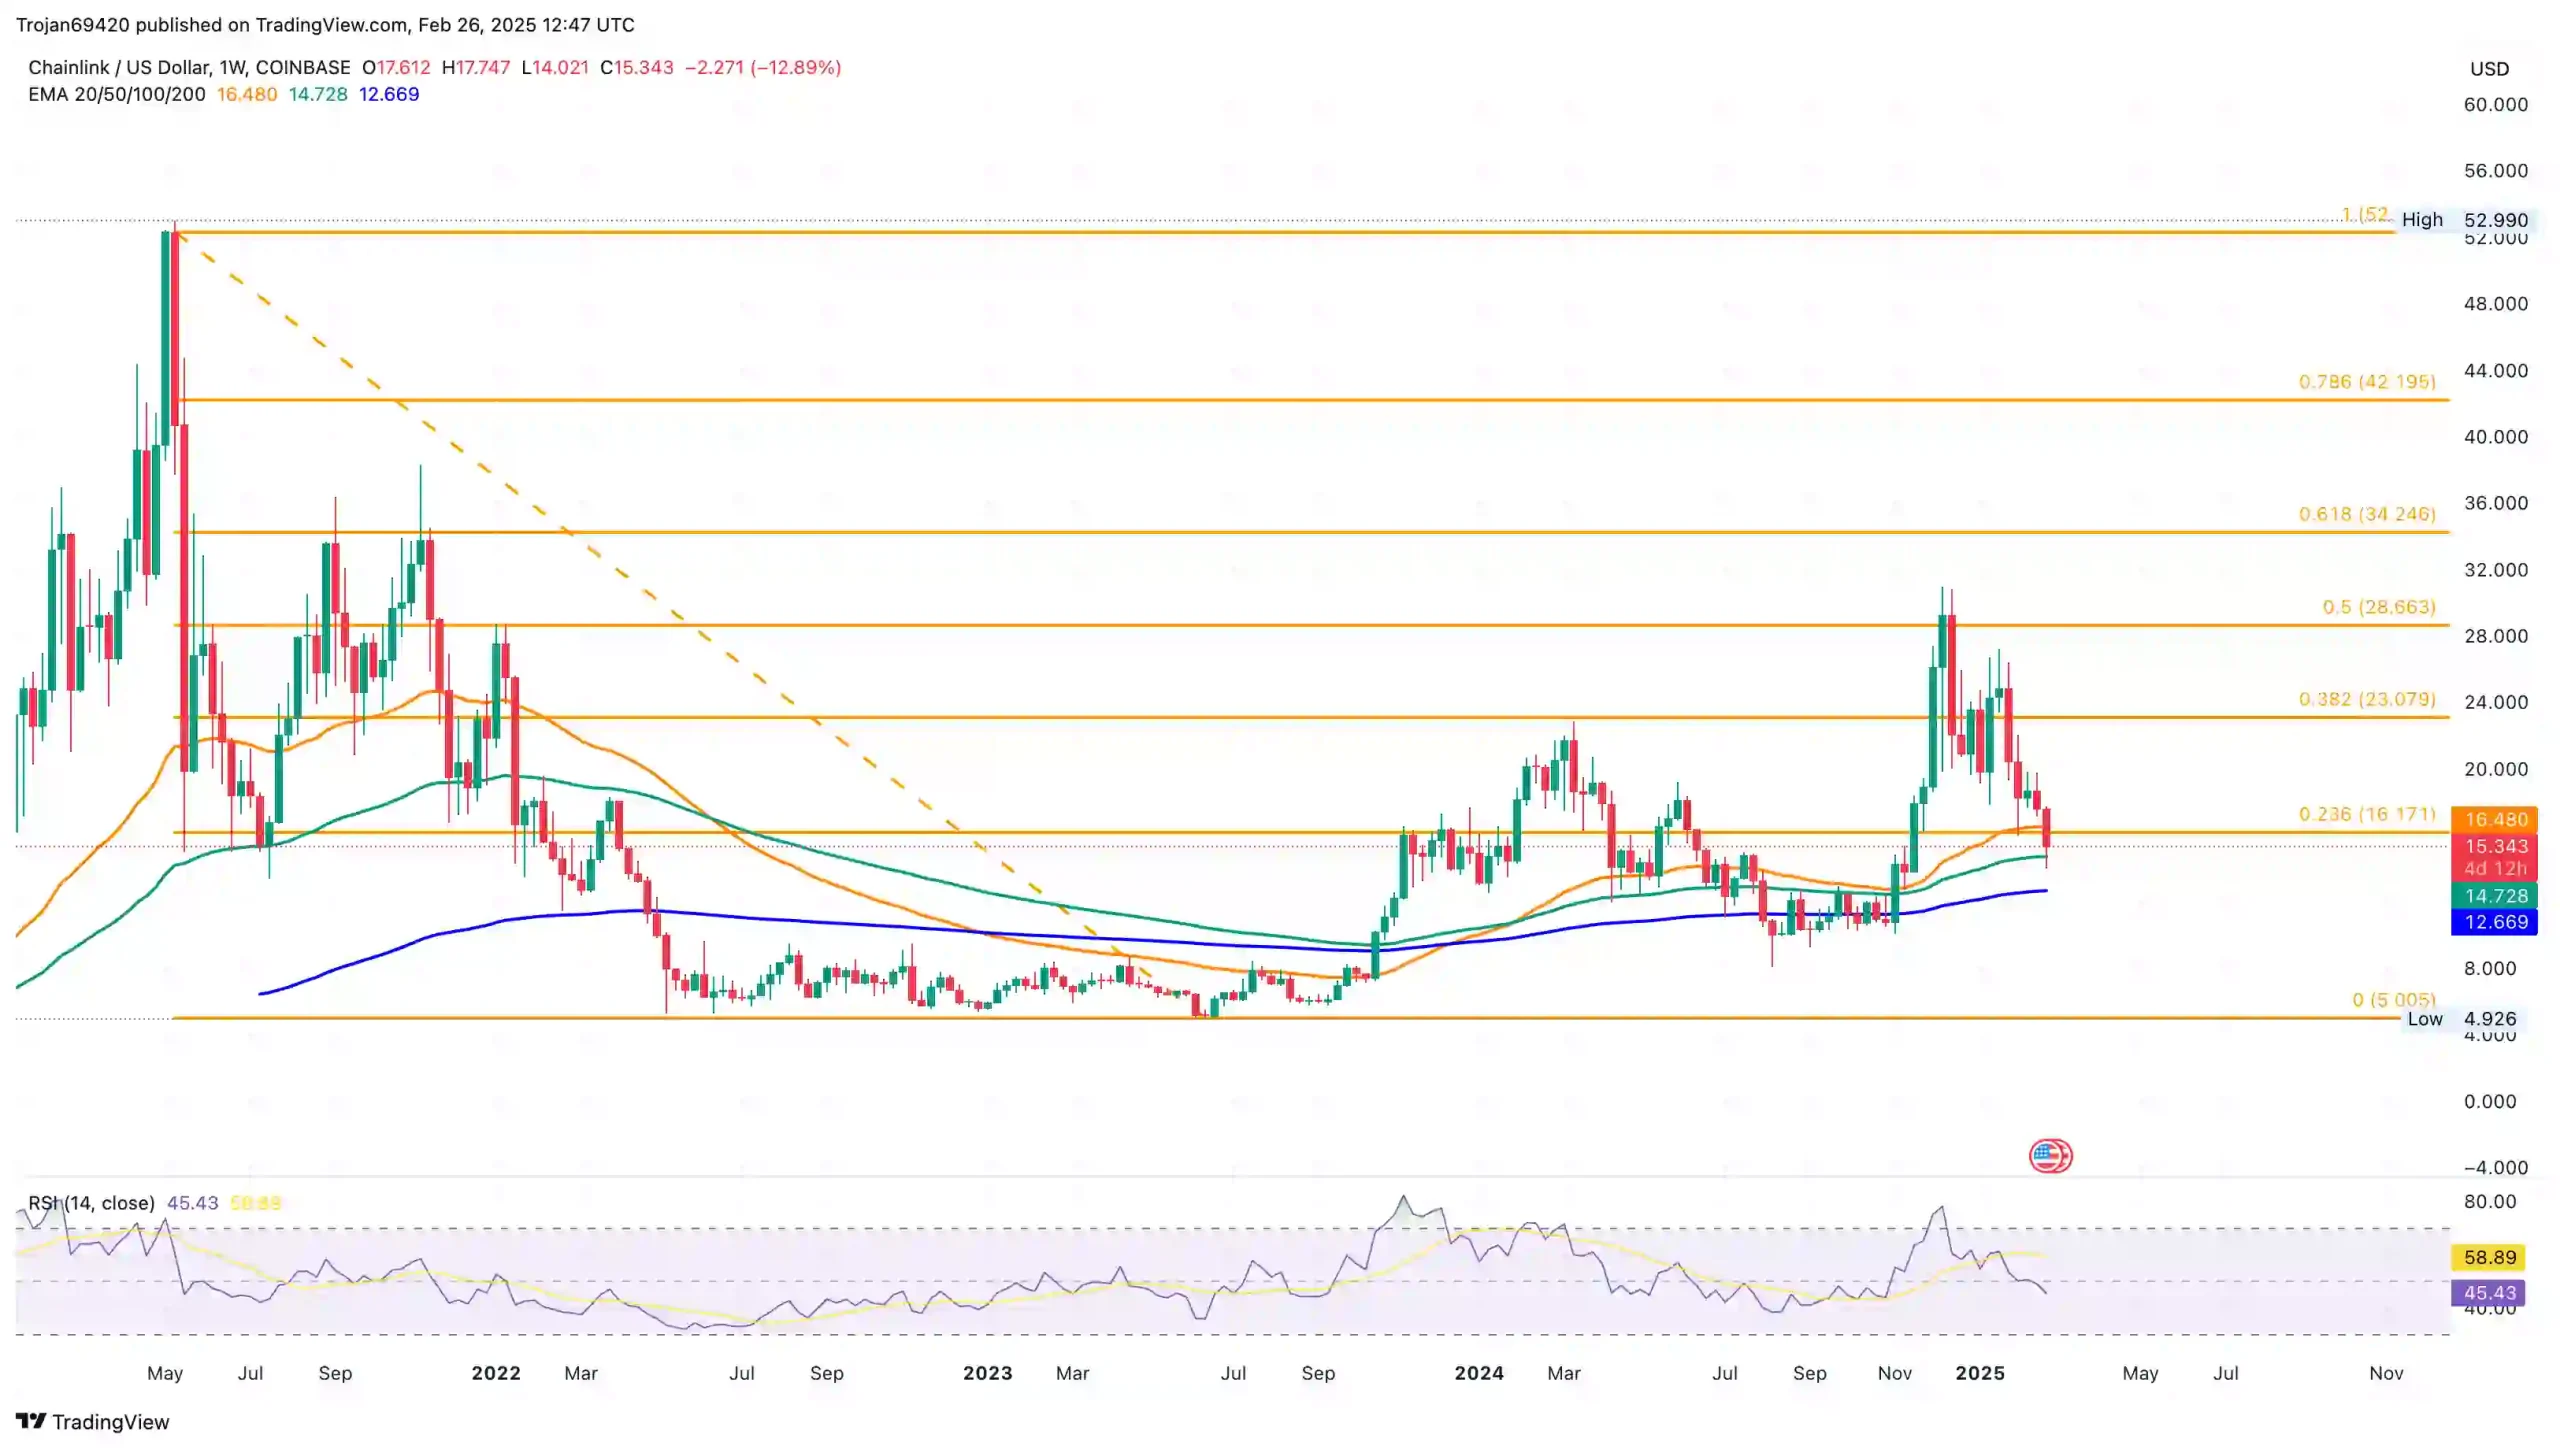
However, the uptrend failed to sustain momentum and quickly plunged below the 38.20% Fibonacci level at $23.00. With minor consolidation, the broader market crash has now brought $LINK price down to $15.48.
With a 7-day low registered at $14.021, the short-term recovery reveals underlying support for Chainlink. In the weekly chart, the downfall has breached the 50-week EMA line and is struggling to take support near the 100-week EMA line.
Key Levels in $LINK Price Trend
The downfall has breached under the 23.60% Fibonacci level at $16.17. If the bull fails to propel the closing price above the Fibonacci level, the breakdown will potentially challenge the lower support levels.
The immediate support level for Chainlink is present at the 100-week EMA line at $14.73, followed by the 200-week EMA line at $12.67.
The downfall has brought the weekly RSI line under the halfway level. This suggests a potential shift in the trend momentum, projecting a potential downfall.
Analyst Predicts Recovery For Chainlink
Supporting the chances of a bullish comeback for bulls to regain the 23.60% level, Ali Martinez highlights a potential reversal possibility.
In his recent tweet, the analyst highlights a TD sequential indicator flashing a buy signal on Chainlink. This comes on the daily chart, hinting at a short-term reversal rally.
As with the 24-hour recovery of more than 5%, a prolonged recovery will likely help bulls sustain dominance at the 23.60% Fibonacci level. With a bullish recovery, the uptrend could challenge the $20 psychological level followed by the 38.20% level at $23.07.

 cryptonewsz.com