
Toncoin ($TON) has faced a prolonged downturn, struggling to regain upward momentum after a tough week. Although it recently recorded a slight daily gain, the asset remains trapped in bearish territory, trading below the $4 mark.
Despite this challenging price performance, analysts suggest that Toncoin may be nearing a significant accumulation phase.
Key Metrics Indicate Potential Recovery
Amid these market conditions, a CryptoQuant contributor, Crazzyblockk, recently shared a detailed outlook on $TON. In a post titled “$TON Enters Key Buy Zone – A Prime Opportunity,” the analyst outlined key findings from the Ton Price Models.
These models indicate that Toncoin has reached the 0.6x 250-day moving average bottom zone—historically considered a strong accumulation level. Crazzyblockk notes that this target="_blank">$TON is undervalued, presenting a potential buying opportunity for long-term investors.
Notably, the Ton Price Models leverage historical data to identify oversold conditions and potential entry points. According to Crazzyblockk, assets trading near 0.6x–0.8x of their 250-day moving average often signal strong buy conditions.
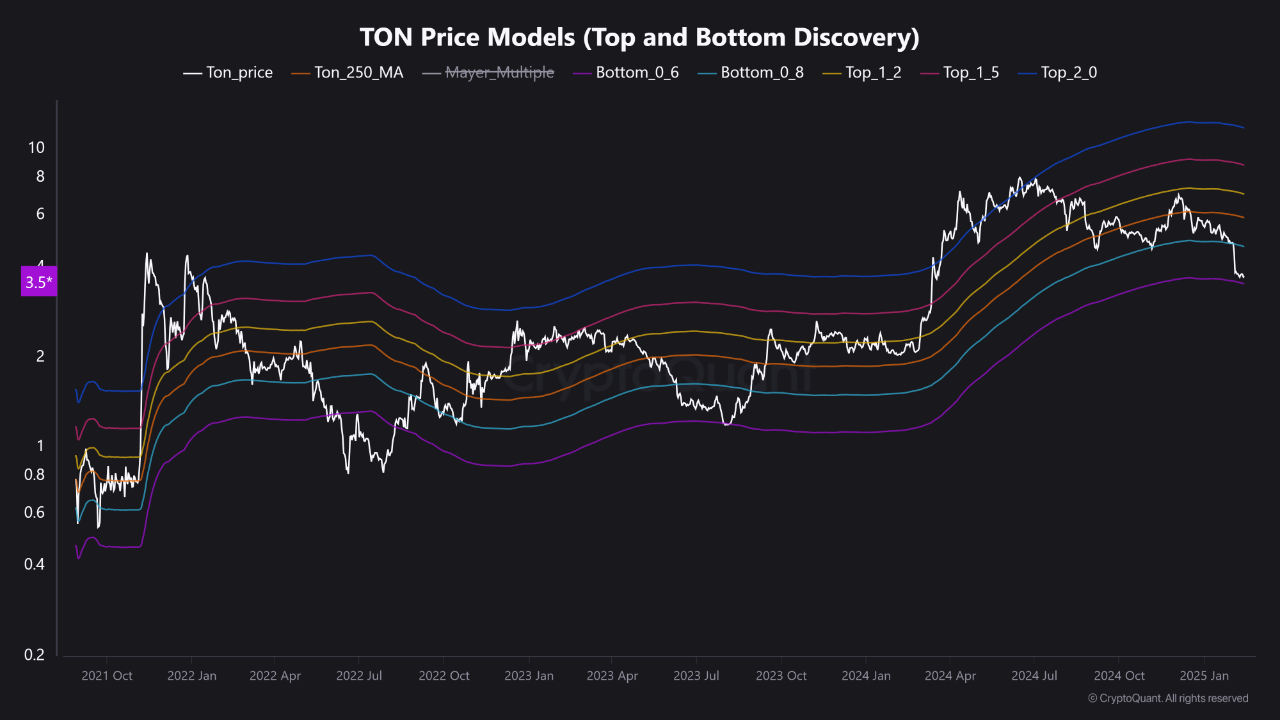
Historically, these levels have served as ideal accumulation zones before major market upturns. The analyst emphasized that $TON’s current price position aligns with previous setups that have led to significant price recoveries, making it a promising target for target="_blank">$3.8 nearing the $4 mark.
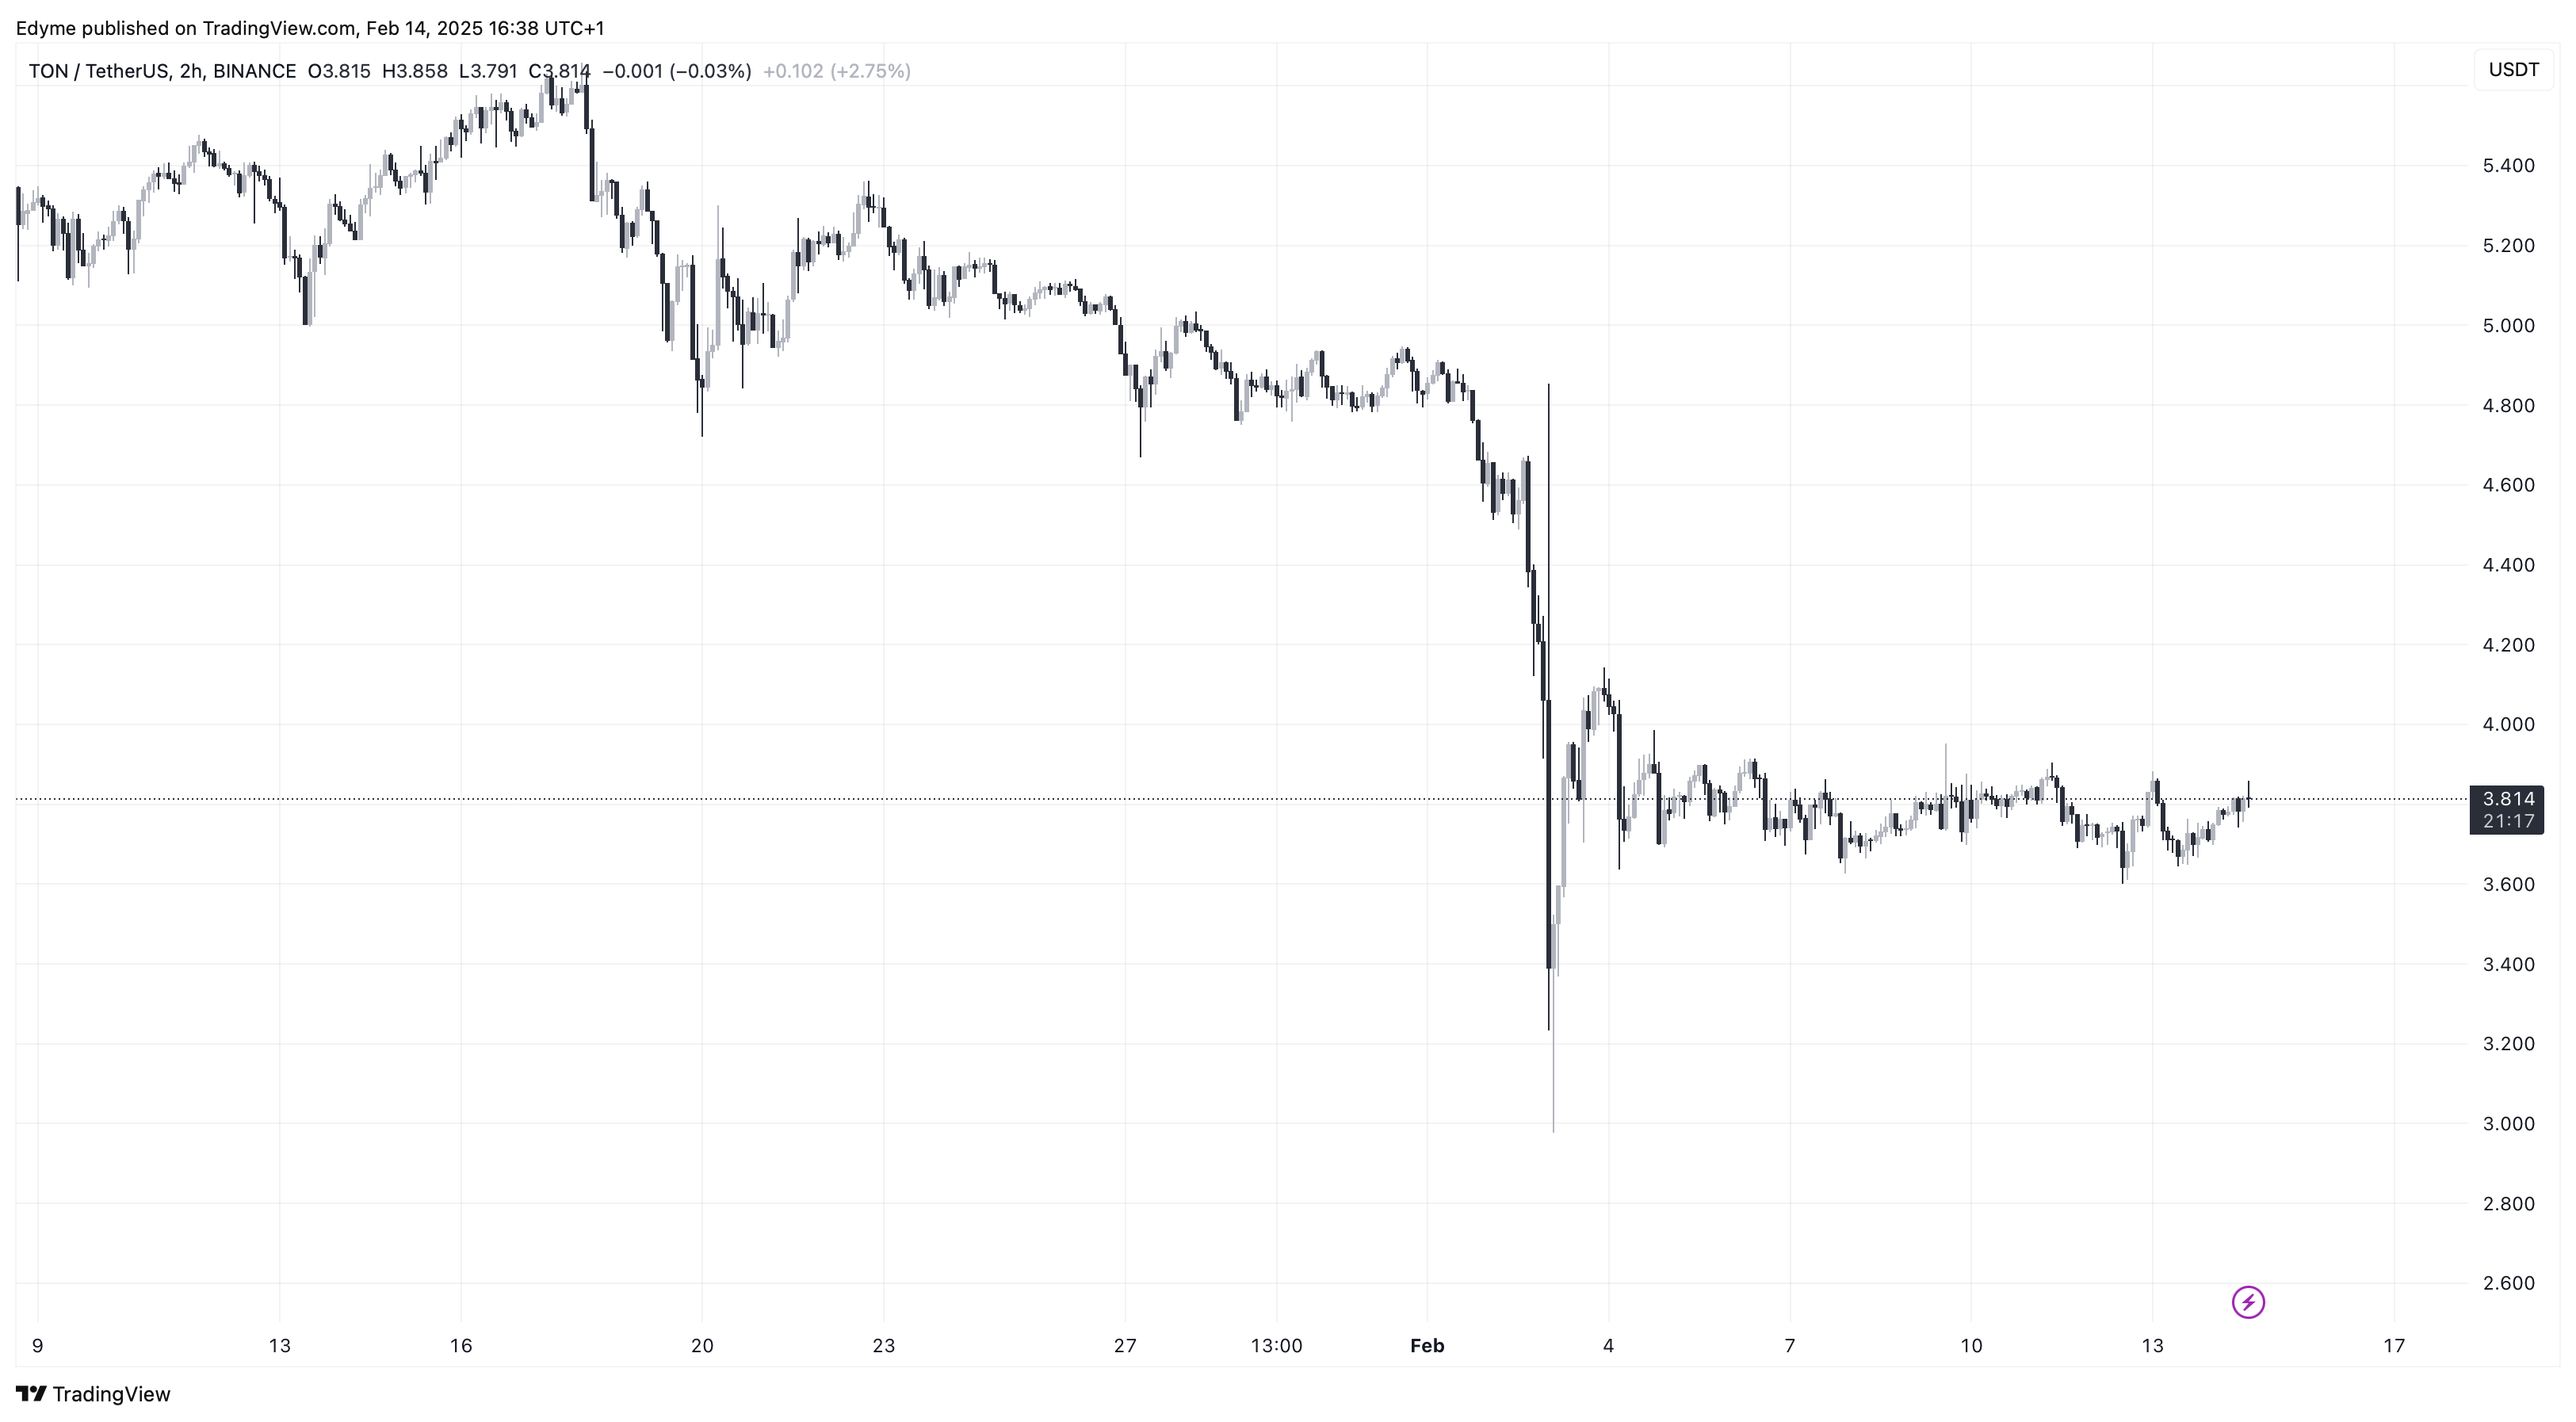
Interestingly, while $TON’s price has risen today, its daily trading volume is notably lower compared to last Friday, when the asset was trading at a similar price level. Last Friday, $TON’s trading volume exceeded $214 million. However, as of today, it has decreased to $161.2 million.
One possible explanation for this drop in trading volume could be a shift in investor behavior, with some market participants holding their positions rather than actively trading, potentially in anticipation of continued price appreciation.
Speaking of price appreciation, a renowned crypto analyst known as Ali on X has recently shared an interesting analysis on Toncoin using the TD Sequential indicator.
This indicator is a tool that helps identify potential trend reversals and exhaustion points in price movements. It works by counting a series of consecutive price bars that close higher (in an uptrend) or lower (in a downtrend) than previous bars, forming a sequential count.
Once the count reaches a certain number—often 9 or 13—the indicator suggests that the prevailing trend may be losing momentum and could reverse or pause. According to Ali, $TON is on the verge of a rebound based on this tool.
#Toncoin $TON is showing signs of a potential rebound as the TD Sequential indicator flashes a buy signal on the weekly chart! pic.twitter.com/nRtabmxjxQ
— Ali (@ali_charts) February 14, 2025
Featured image created with DALL-E, Chart from TradingView