Solana’s Demand Pressure Builds as Active Addresses & Funding Rates Climb
According to TheBlock data, the number of active addresses on the Solana network has bounced from 4.11 Million to 4.39 Million, registering a 6.8% weekly surge. A higher number of active addresses implies that more users are transacting on Solana, leading to higher network utilization.
Historical data shows this development drives demand pressure for assets and bolsters a sustained price recovery.
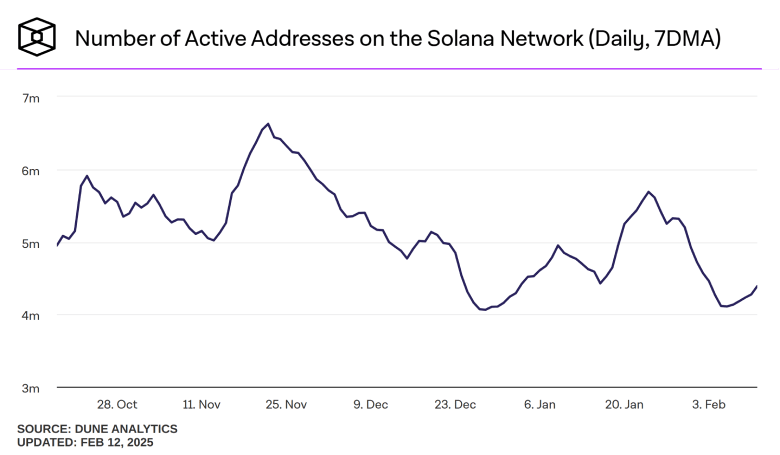
Network Activity | TheBlock
Moreover, the $SOL OI-Weighted Funding Rate rebounded to $0.0062, according to Coinglass data. The positive value indicates the market buyers are willing to a premium value to sellers, projecting their confidence for a higher rally.
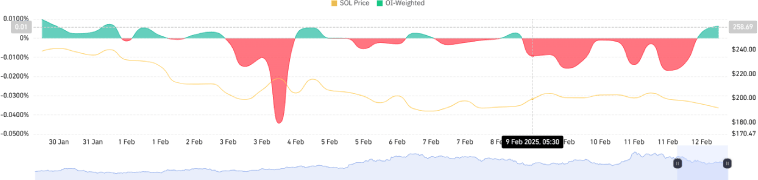
$SOL OI-Weighted Funding Rate | CoinGlass
Solana Price: Double-Top Pattern Hints at Deeper Correction
Over the past three weeks, the Solana price showed a correction from $295 to $196, projecting a 33.5% loss. This downswing in the daily chart shows the formation of key reversal patterns called double-top.
The pattern is characterized by two major downswings from a fixed resistance zone, displaying an ‘M’ shaped setup.
If market uncertainty persists, the $SOL price could plunge 10.6% to challenge the neckline support at $175. A potential breakdown will accelerate the selling pressure and drive a price correction to $120.
On the contrary, the $175 floor is coinciding close to the 38.2% FIB level, creating a strong support zone for buyers. If Solana’s price shows demand pressure at this support, the current consolidation trend will prolong to rebuild bullish momentum.
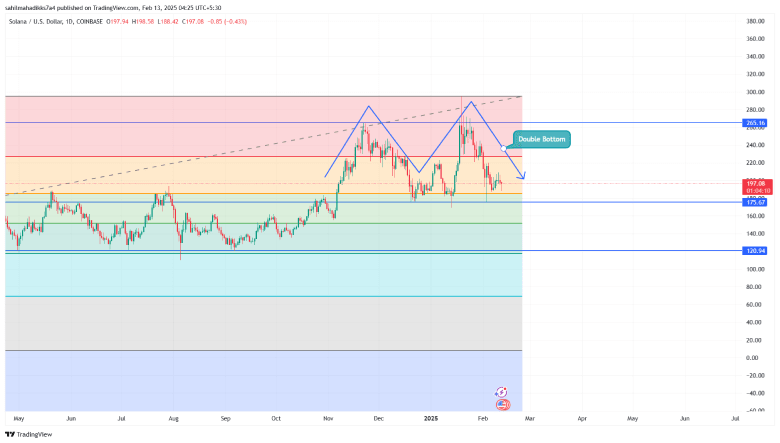
$SOL/USDT -1d xga
However, it is less likely for $SOL to reclaim $300 in the remaining two weeks of February.

 cryptonewsz.com