
FTX Token ($FTT) has emerged as the day’s top performer, defying the broader market downturn with a rally. As overall trading activity stalls, the total crypto market capitalization has dropped by $53 billion in the past 24 hours.
However, $FTT has bucked this trend, registering a 7% surge and outpacing major assets. The altcoin appears poised for extended gains as on-chain data reveals a rise in bullish bias toward it.
$FTT Leads, Others Follow
A key sign of renewed demand for $FTT is the uptick in spot inflows. While still modest at $205,000 on Wednesday, this marks a reversal after multiple days of outflows, indicating a gradual shift in market sentiment toward the altcoin.
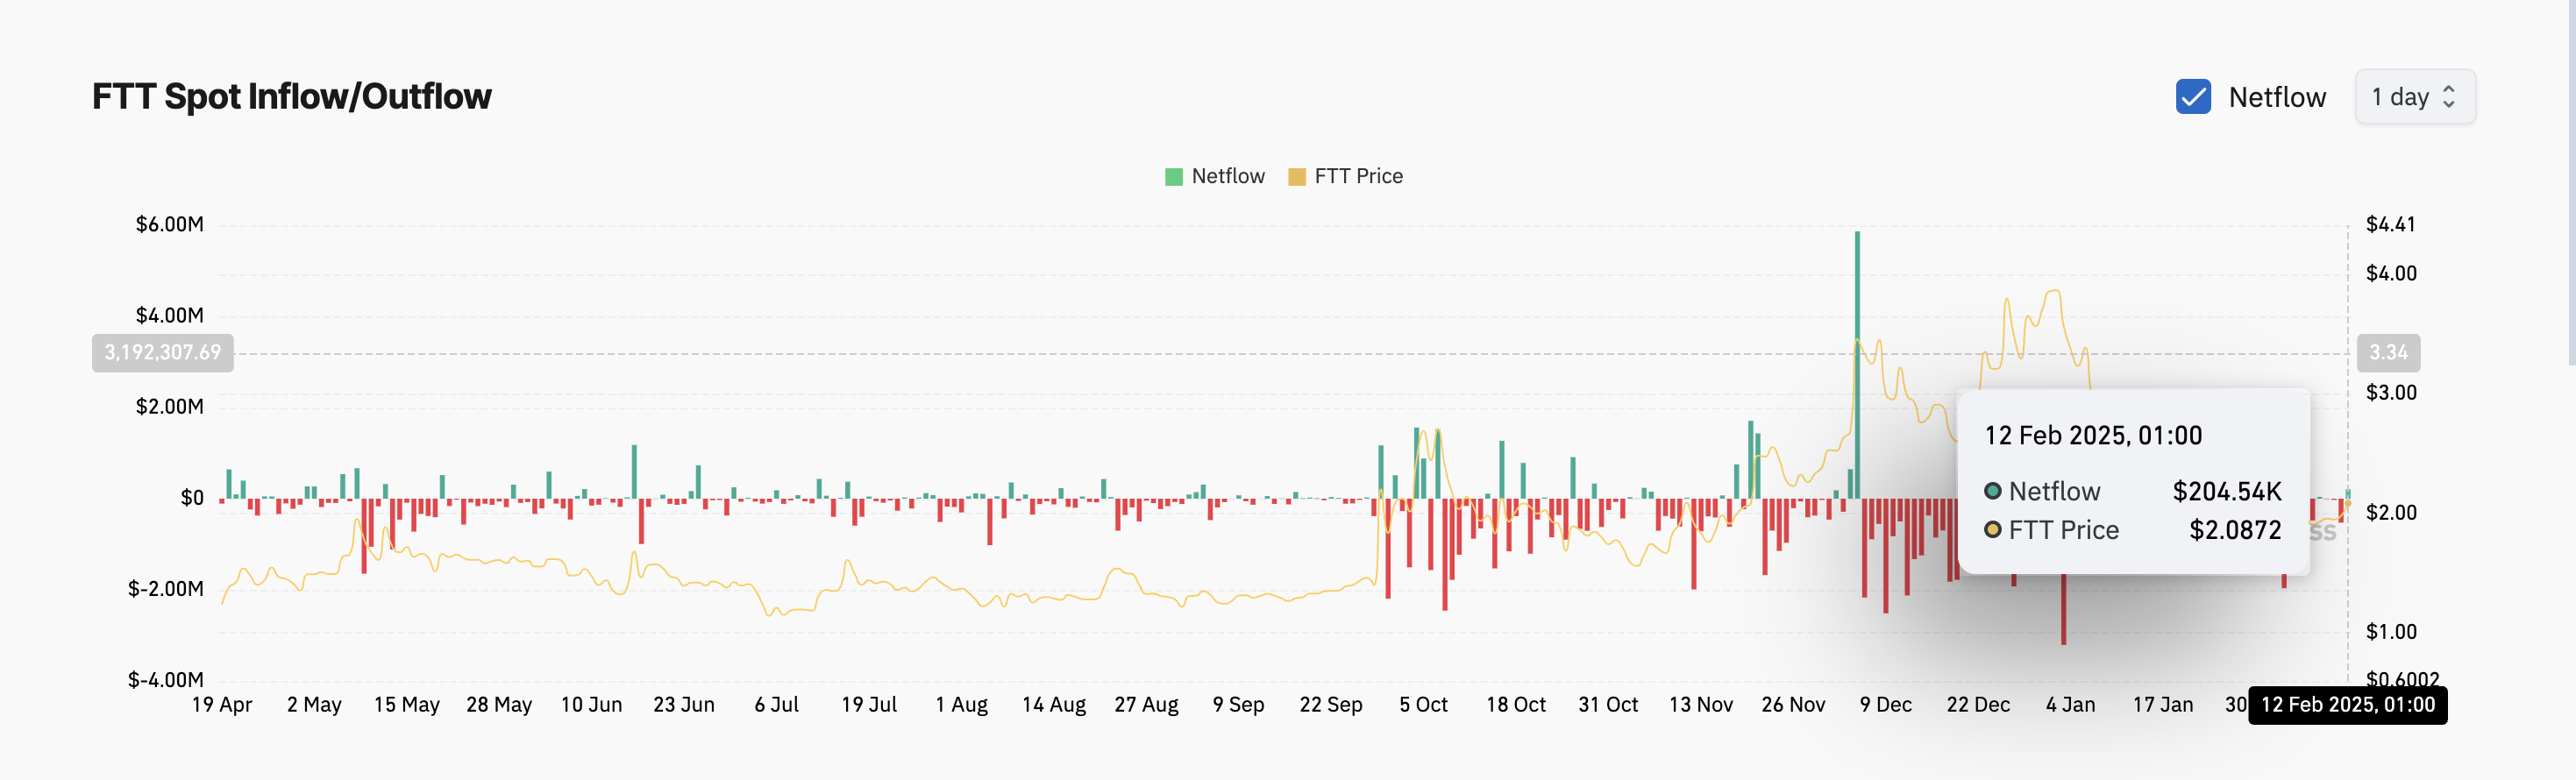
When an asset experiences spot inflows, it means an increase in the purchase of that asset in the spot market, where transactions are settled immediately. Therefore, this trend suggests a gradual rise in demand for $FTT, as its buyers are willing to acquire it at the current market price.
Furthermore, the token’s rising open interest supports this bullish outlook. As of this writing, this is at $2.03 million, increasing by 10% over the past 24 hours.
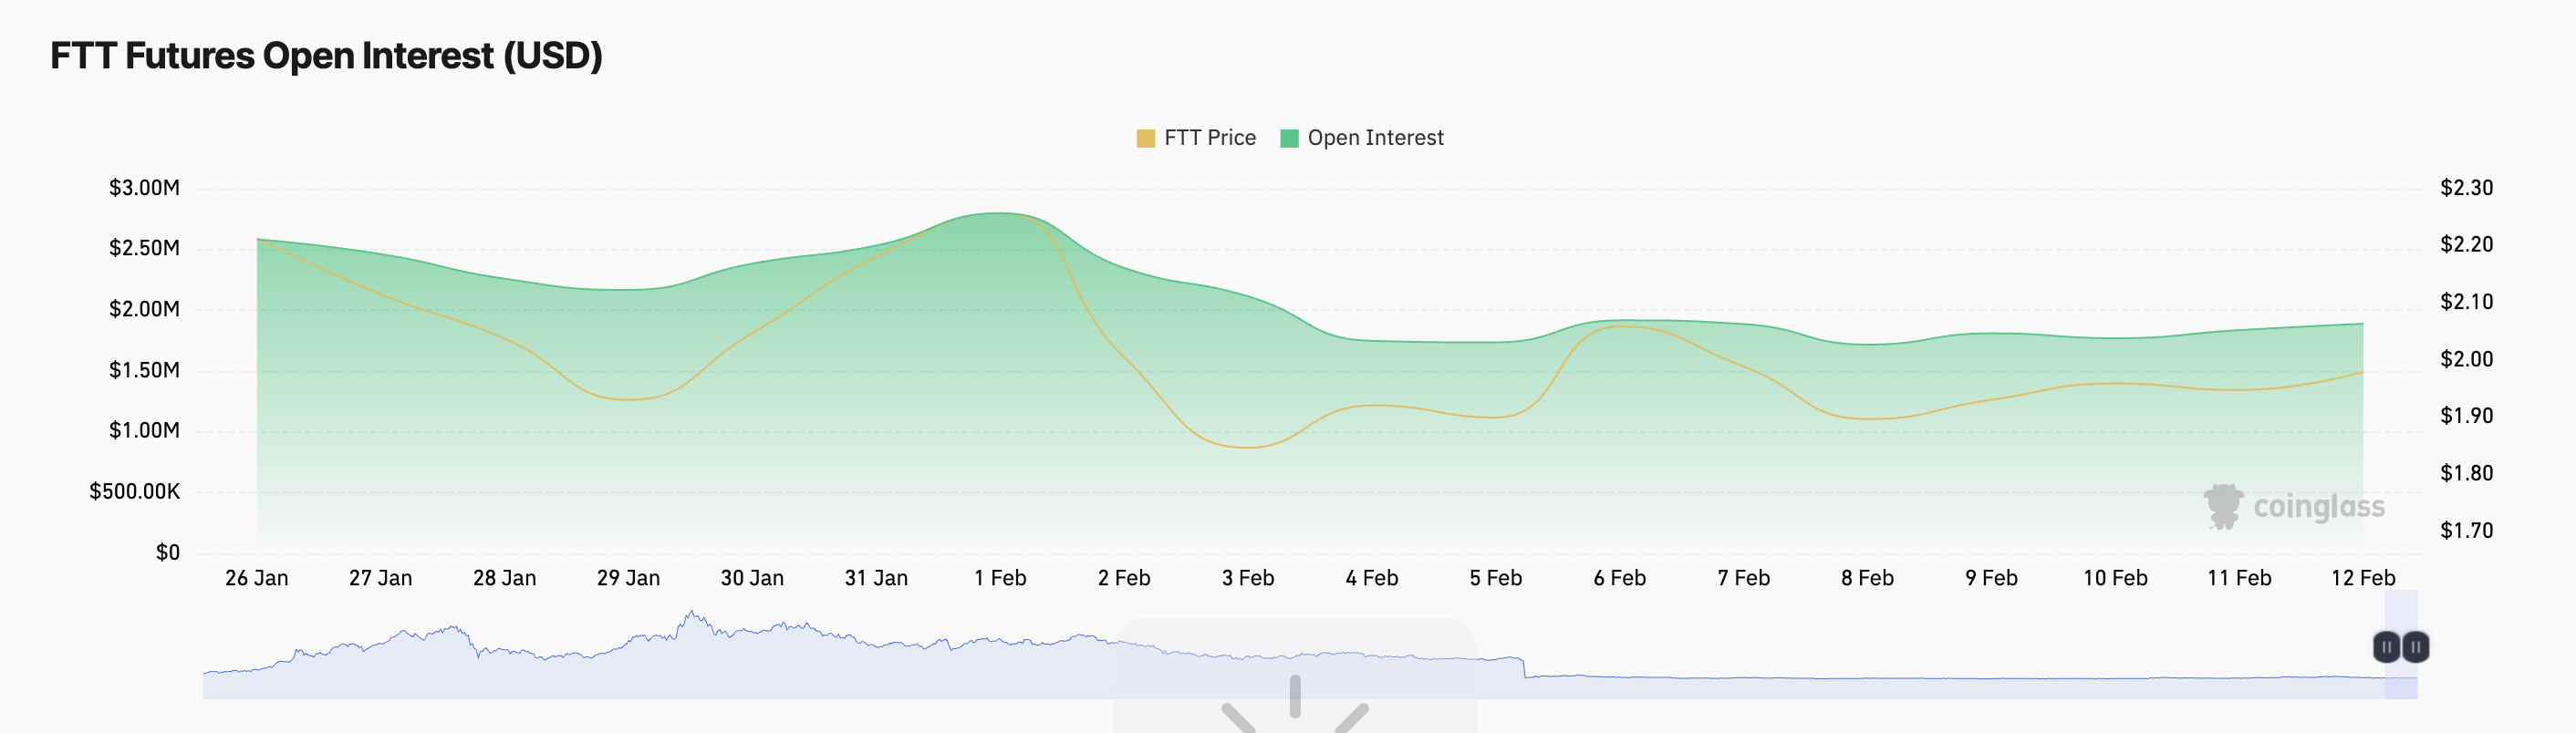
Open interest measures the total number of outstanding derivative contracts, such as futures or options, that have not been settled. When an asset’s open interest surges during a price rally, it indicates that more traders are entering new positions rather than closing existing ones, signaling strong market participation.
This trend suggests growing confidence in $FTT’s current rally, as higher open interest combined with rising prices can point to sustained bullish momentum.
$FTT Price Prediction: Can Bulls Push It Higher?
An assessment of the $FTT/USD one chart shows the token attempting to stabilize above its 20-day exponential moving average (EMA), confirming the gradual shift in market trend.
The 20-day EMA measures an asset’s average price over the past 20 trading days by giving more weight to recent data, making it a responsive gauge of short-term trends. When an asset’s price breaks above this key moving average, it signals a shift toward bullish momentum, as traders often view this as an early indication of upward trend continuation.
If demand strengthens and $FTT continues its rally, it could break above its 20-day EMA and climb toward $2.27. A successful breach of this resistance could propel the token’s value to $2.57.
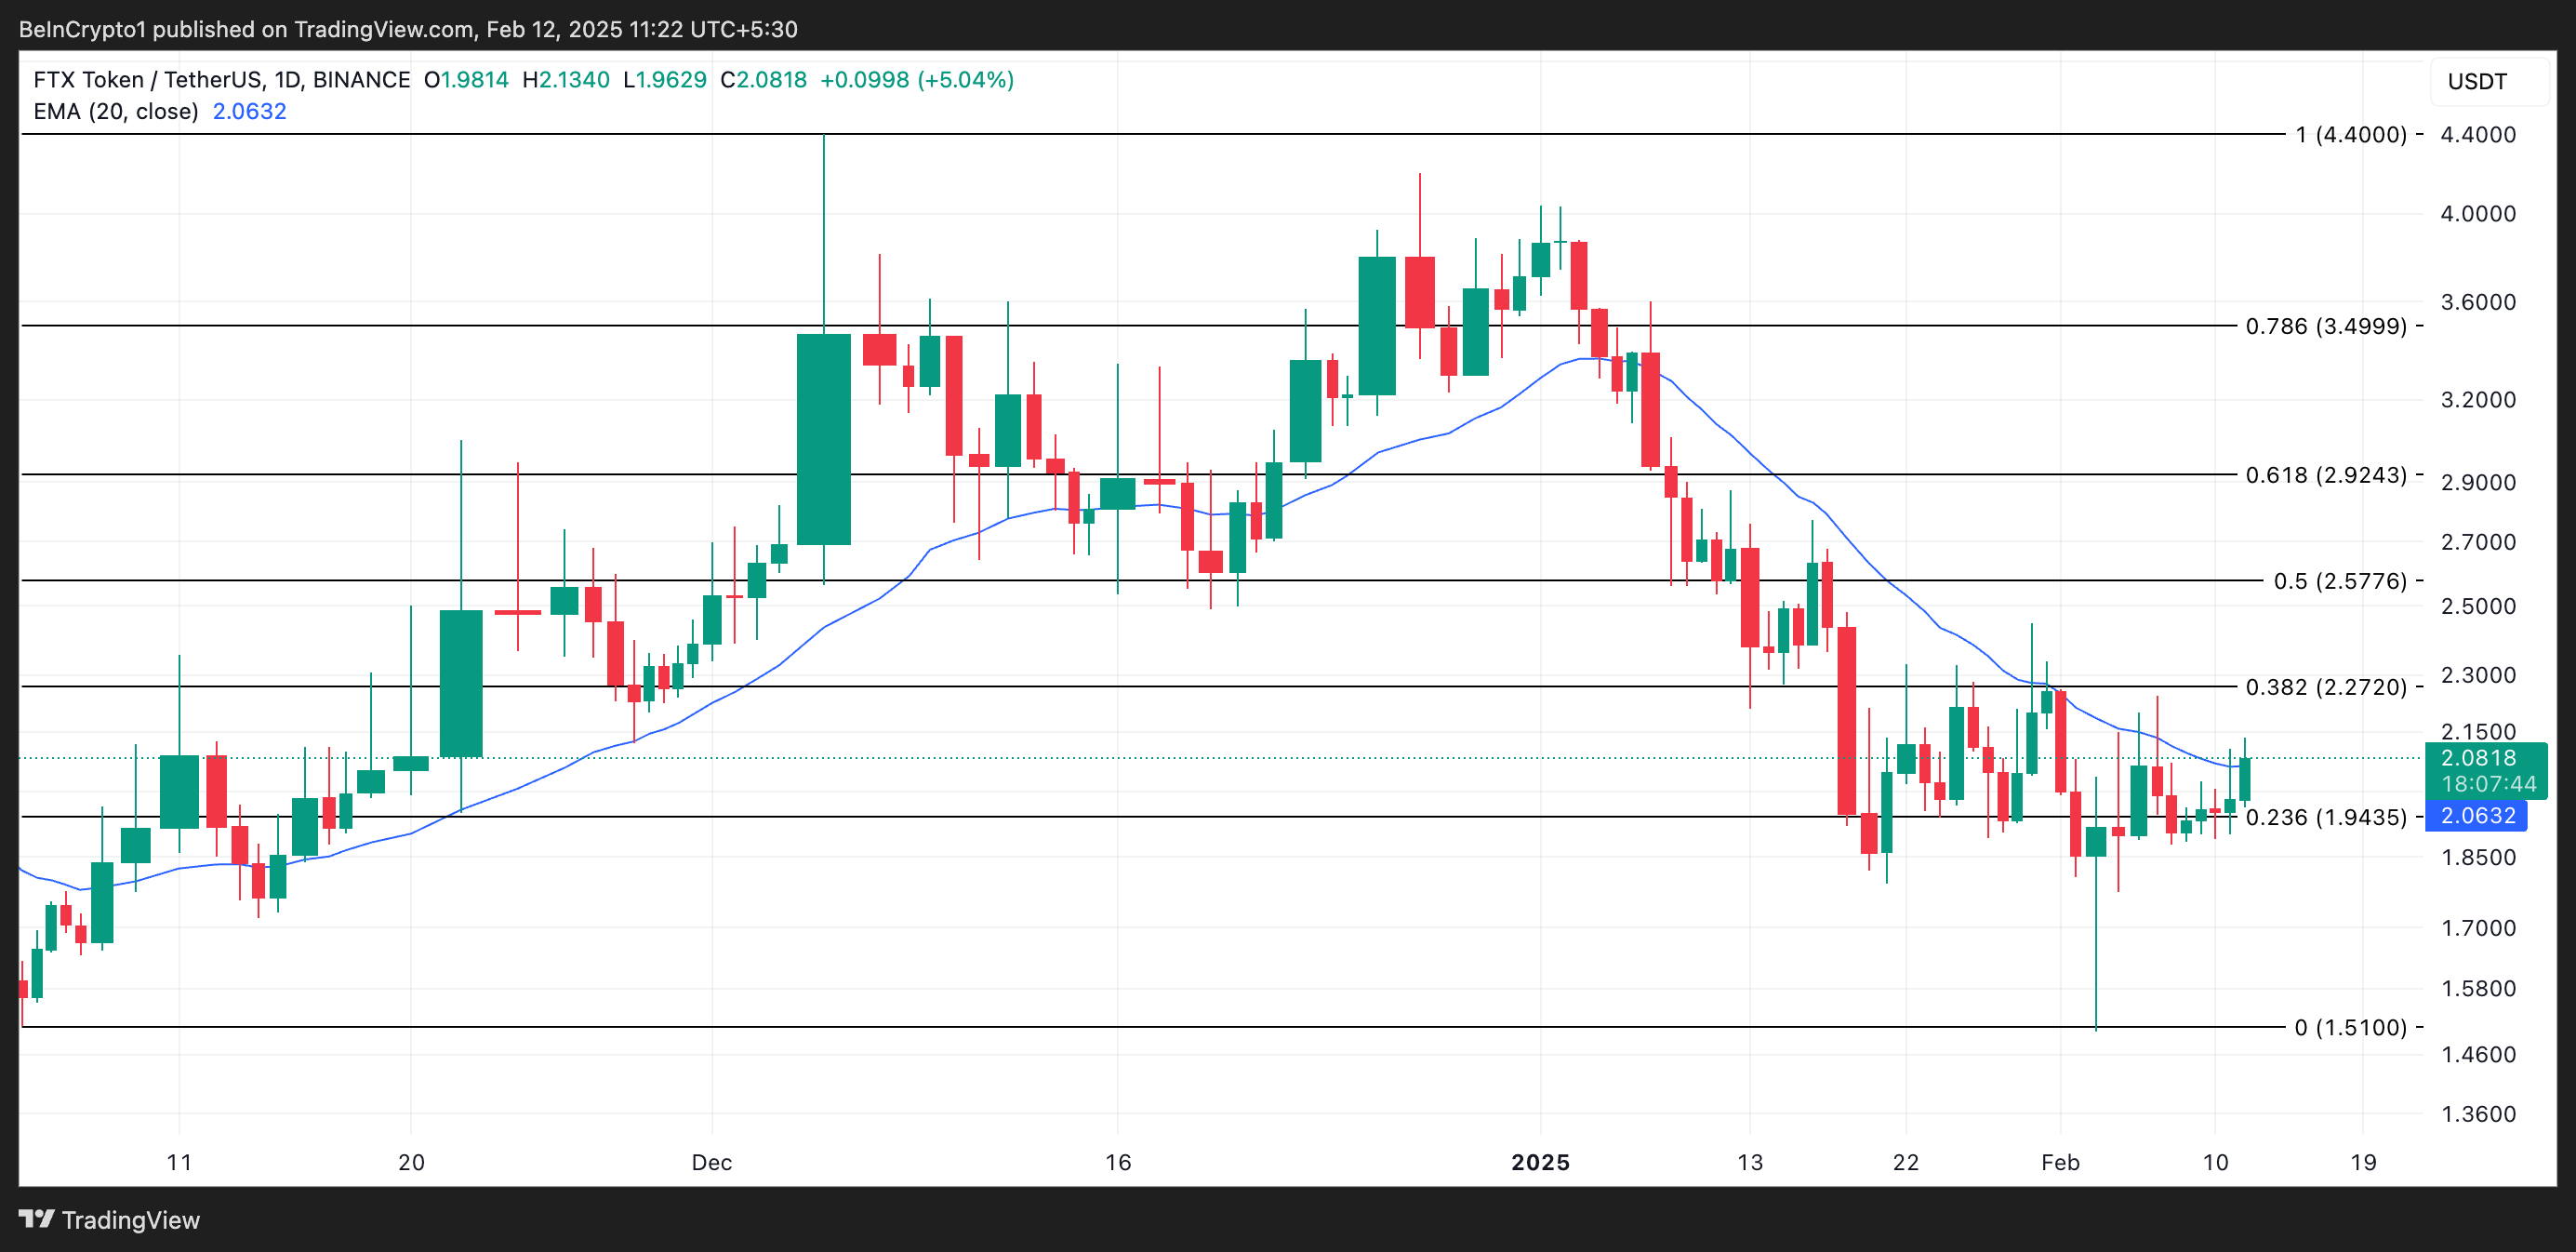
However, if profit-taking commences, the token could lose its recent gains and plummet to $1.94.