$BTC,
$ETH,
$SPX,
$VIRTUAL,
$RAY 2">
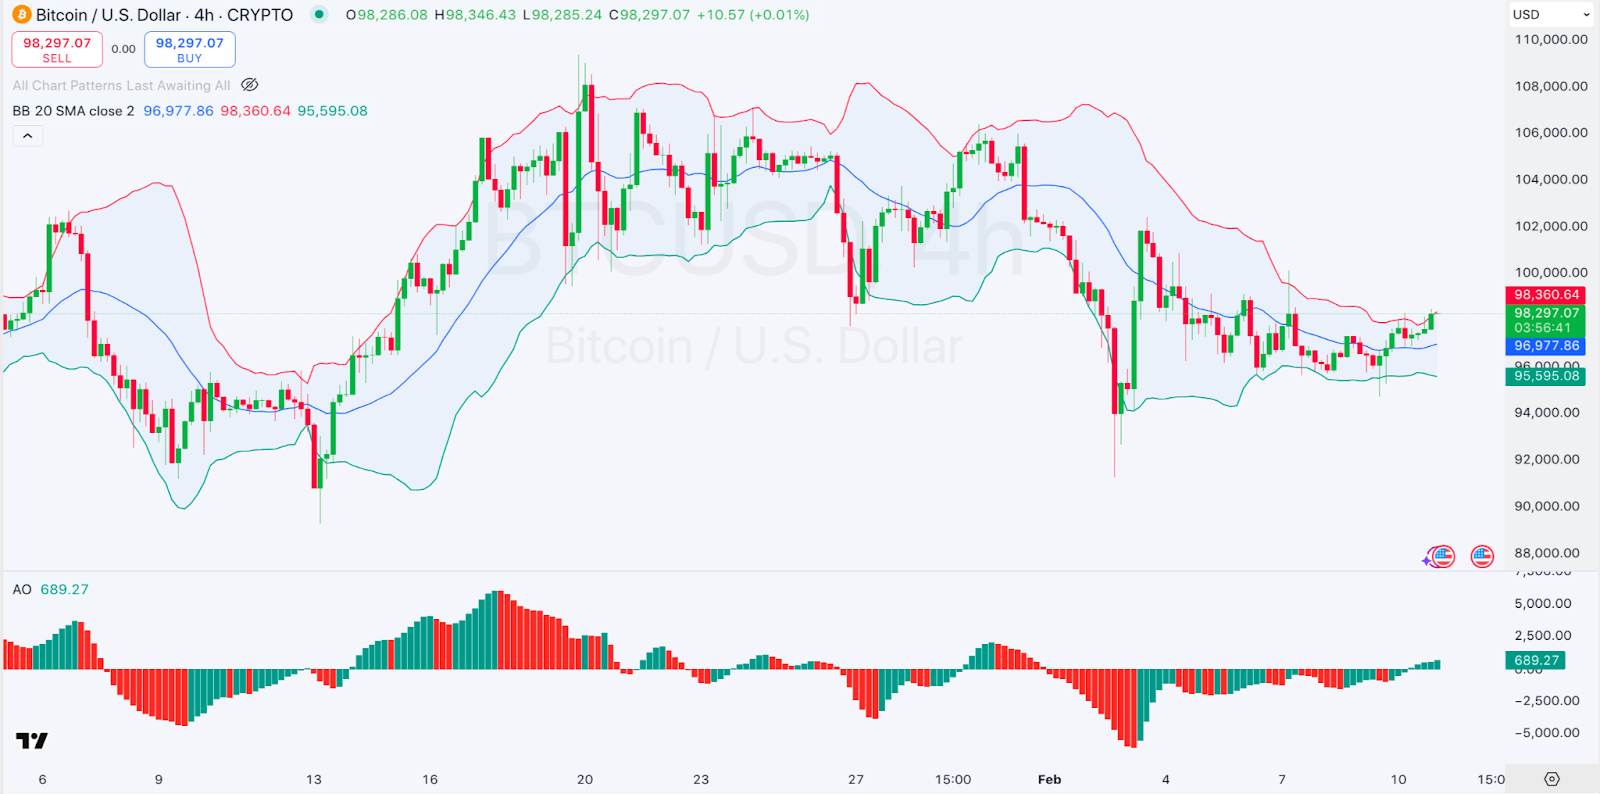
4-hour $BTC/USD Chart | Source: TradingView
Ethereum Price Review
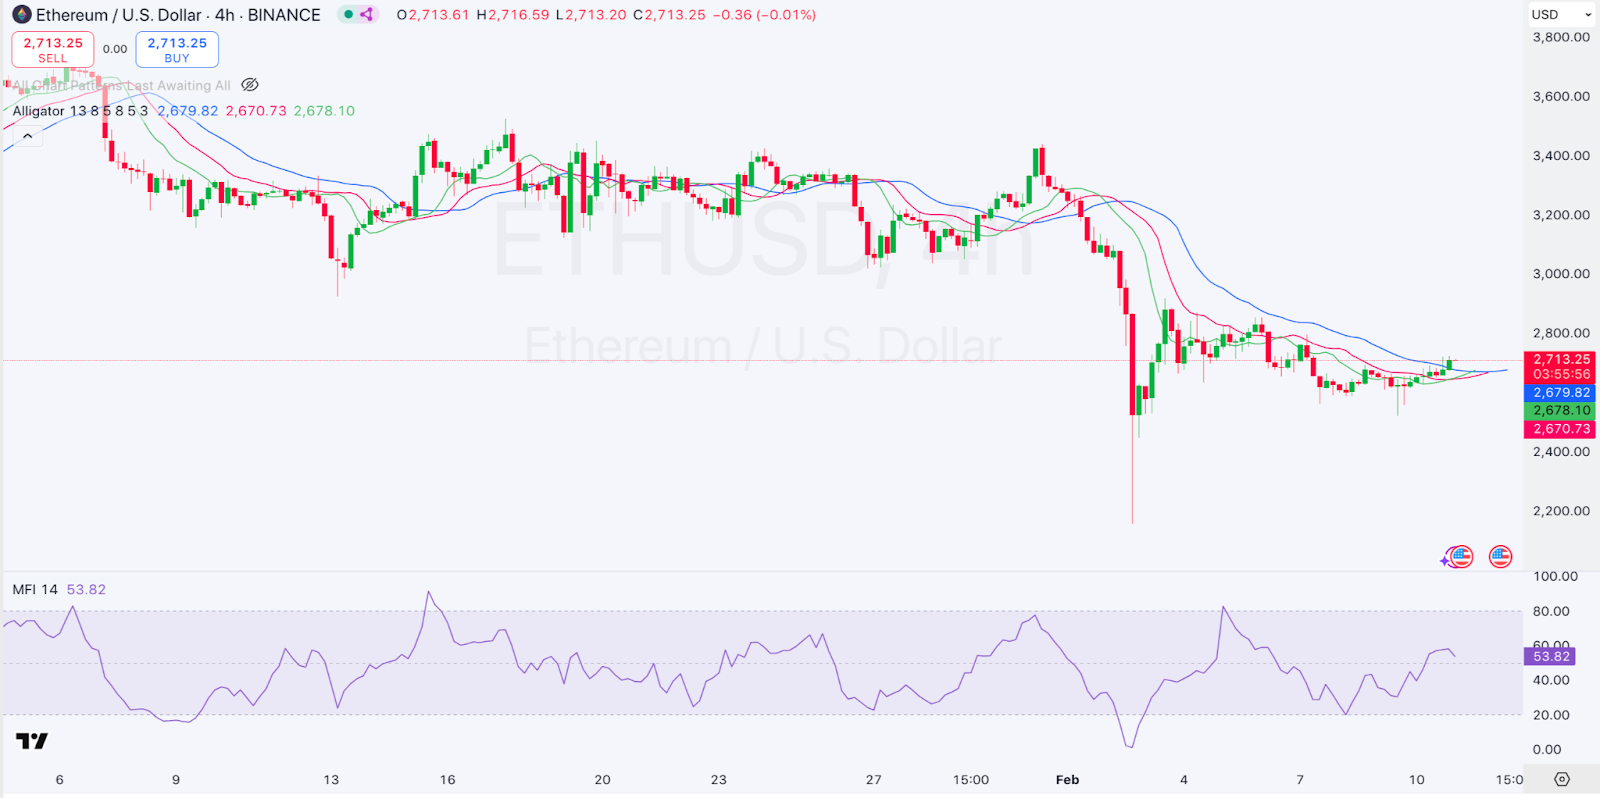
Ethereum, $ETH, is also among the gainers in today’s session as also seen from its price movements. Looking at an in-depth analysis, we see that the Alligator Indicator shows mixed signals, with the moving averages slightly converging, indicating indecision in the market.
On the other hand, we see that the MFI is at 53.82, suggesting a neutral state, neither overbought nor oversold. Ethereum traded at $2,709 as of press time, representing a 2.34% increase over the last 24 hours.
$BTC,
$ETH,
$SPX,
$VIRTUAL,
$RAY 3">
4-hour $ETH/USD Chart | Source: TradingView
SPX6900 Price Review
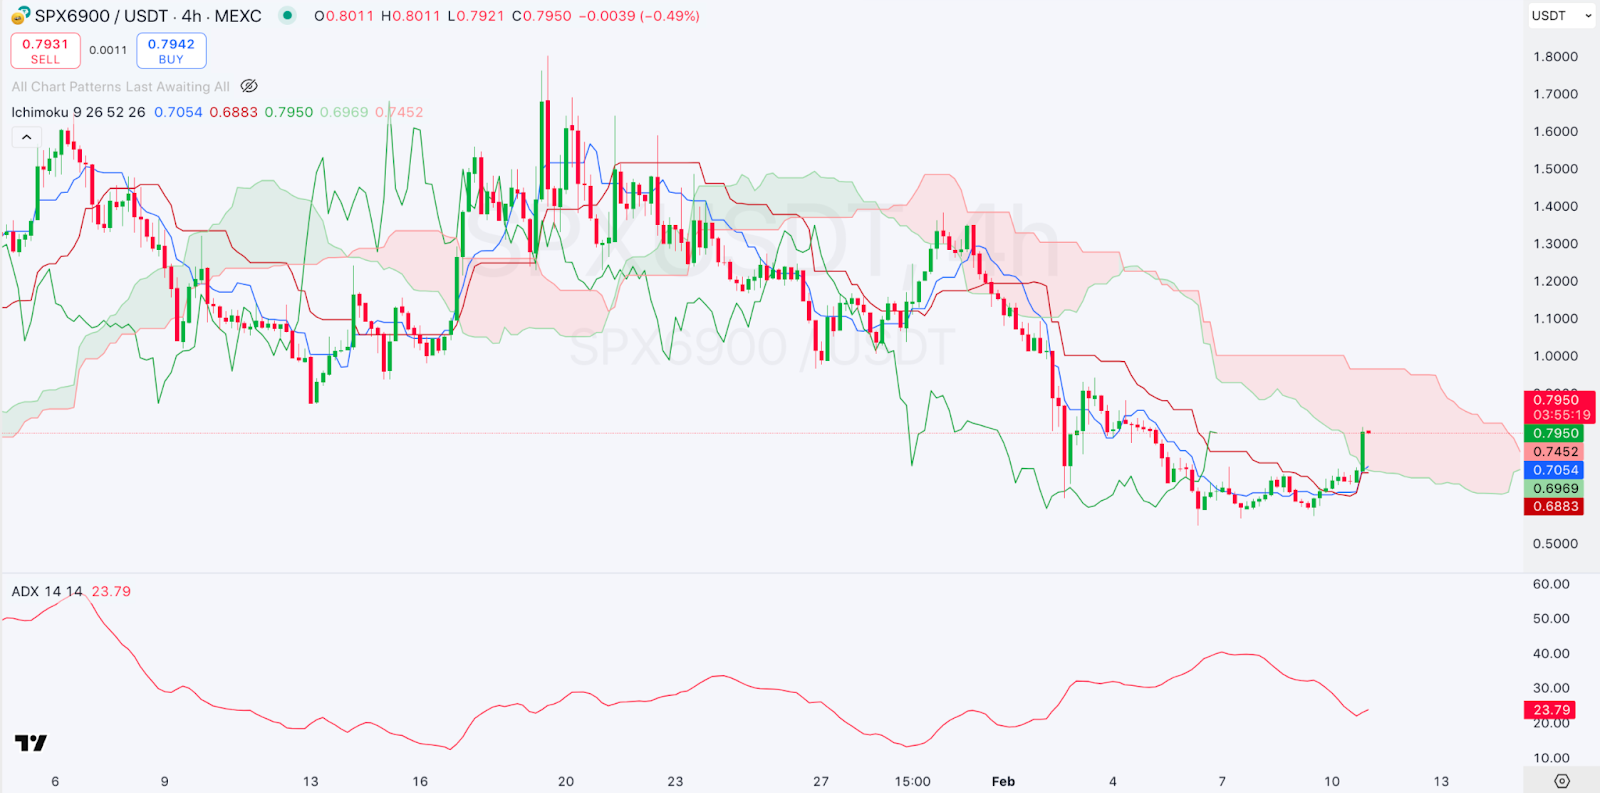
SPX6900, $SPX, is also among the gainers in today’s session as also seen from its price movements. Looking at an in-depth analysis, we see that the price is below the Ichimoku Cloud, suggesting bearish conditions.
On the other hand, the ADX is at 23.79, which is relatively low, indicating weak trend strength. The price recently bounced from the $0.6883 support, attempting a recovery. SPX6900 traded at $0.7929 as of press time, representing a 20.84% increase over the last 24 hours.
$BTC,
$ETH,
$SPX,
$VIRTUAL,
$RAY 4">
4-hour $SPX/$USDT Chart | Source: TradingView
Virtuals Protocol Price Review
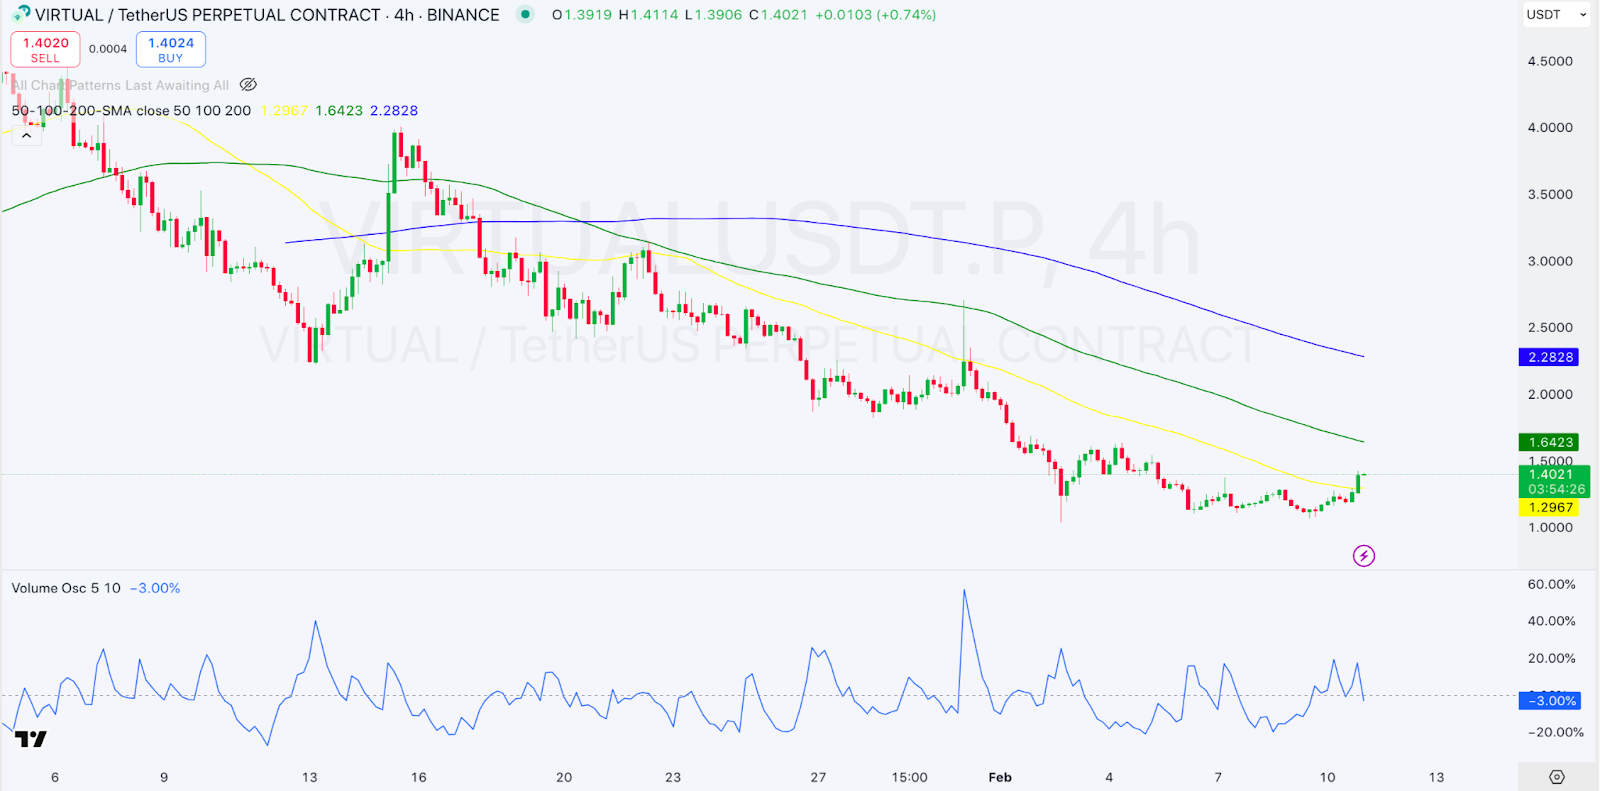
Virtuals Protocol, $VIRTUAL, is also among the gainers in today’s session as also seen from its price movements. Looking at an in-depth analysis, we see that the price is below the 50, 100, and 200 SMAs, indicating a strong downtrend. The volume oscillator is at -3.00%, suggesting weak buying pressure.
Resistance is at $1.642 (50 SMA) and $2.282 (200 SMA), with support at $1.296. Virtuals Protocol traded at $1.44 as of press time, representing a 22.82% increase over the last 24 hours.
$BTC,
$ETH,
$SPX,
$VIRTUAL,
$RAY 5">
4-hour $VIRTUAL/$USDT Chart | Source: TradingView
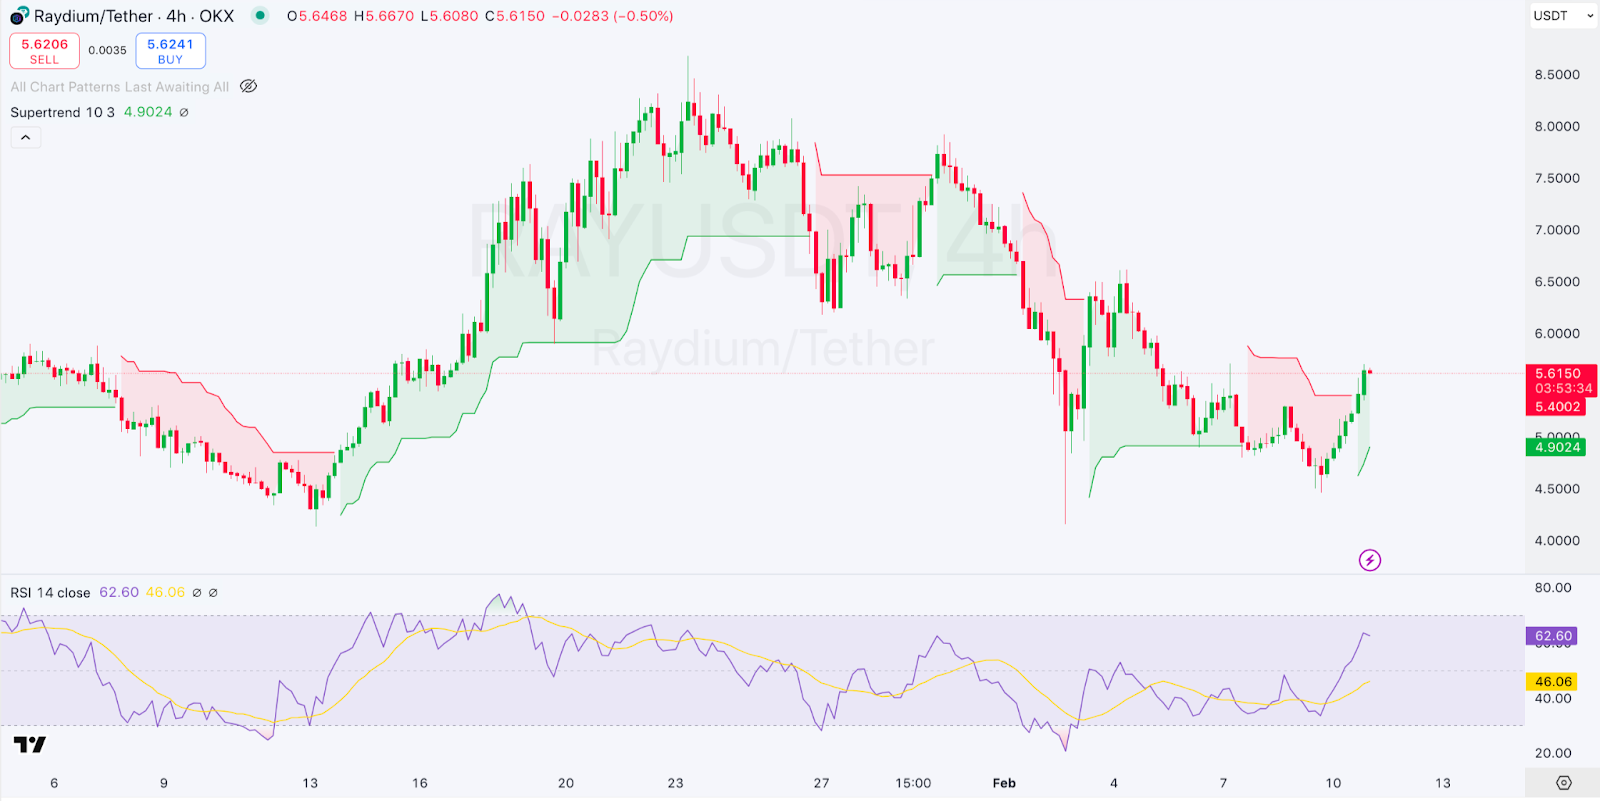
Raydium Price Review
Raydium, $RAY, is also among the gainers in today’s session as also seen from its price movements. Looking at an in-depth analysis, we see that the Supertrend flipped bullish, indicating an early trend reversal.
On the other hand, we see that the RSI is at 62.60, nearing overbought levels but still in a bullish zone. Raydium traded at $5.68 as of press time, representing a 15.26% increase over the last 24 hours.
$BTC,
$ETH,
$SPX,
$VIRTUAL,
$RAY 6">
4-hour $RAY/$USDT Chart | Source: TradingView

 blockchainreporter.net