
Solana-based meme coin $FARTCOIN has steadily declined over the past week. It has shed 31% of its value in the past seven days amid waning demand.
As the bearish sentiment against the meme coin strengthens, $FARTCOIN appears poised to extend its decline to a two-month price low.
$FARTCOIN Witnesses Weakening Demand
The double-digit decline in $FARTCOIN’s value has pushed its price below the 20-day exponential moving average (EMA). At press time, this key moving average forms a dynamic resistance level above $FARTCOIN’s price at $1.04. The token would struggle to break above this level if demand continues to plummet.
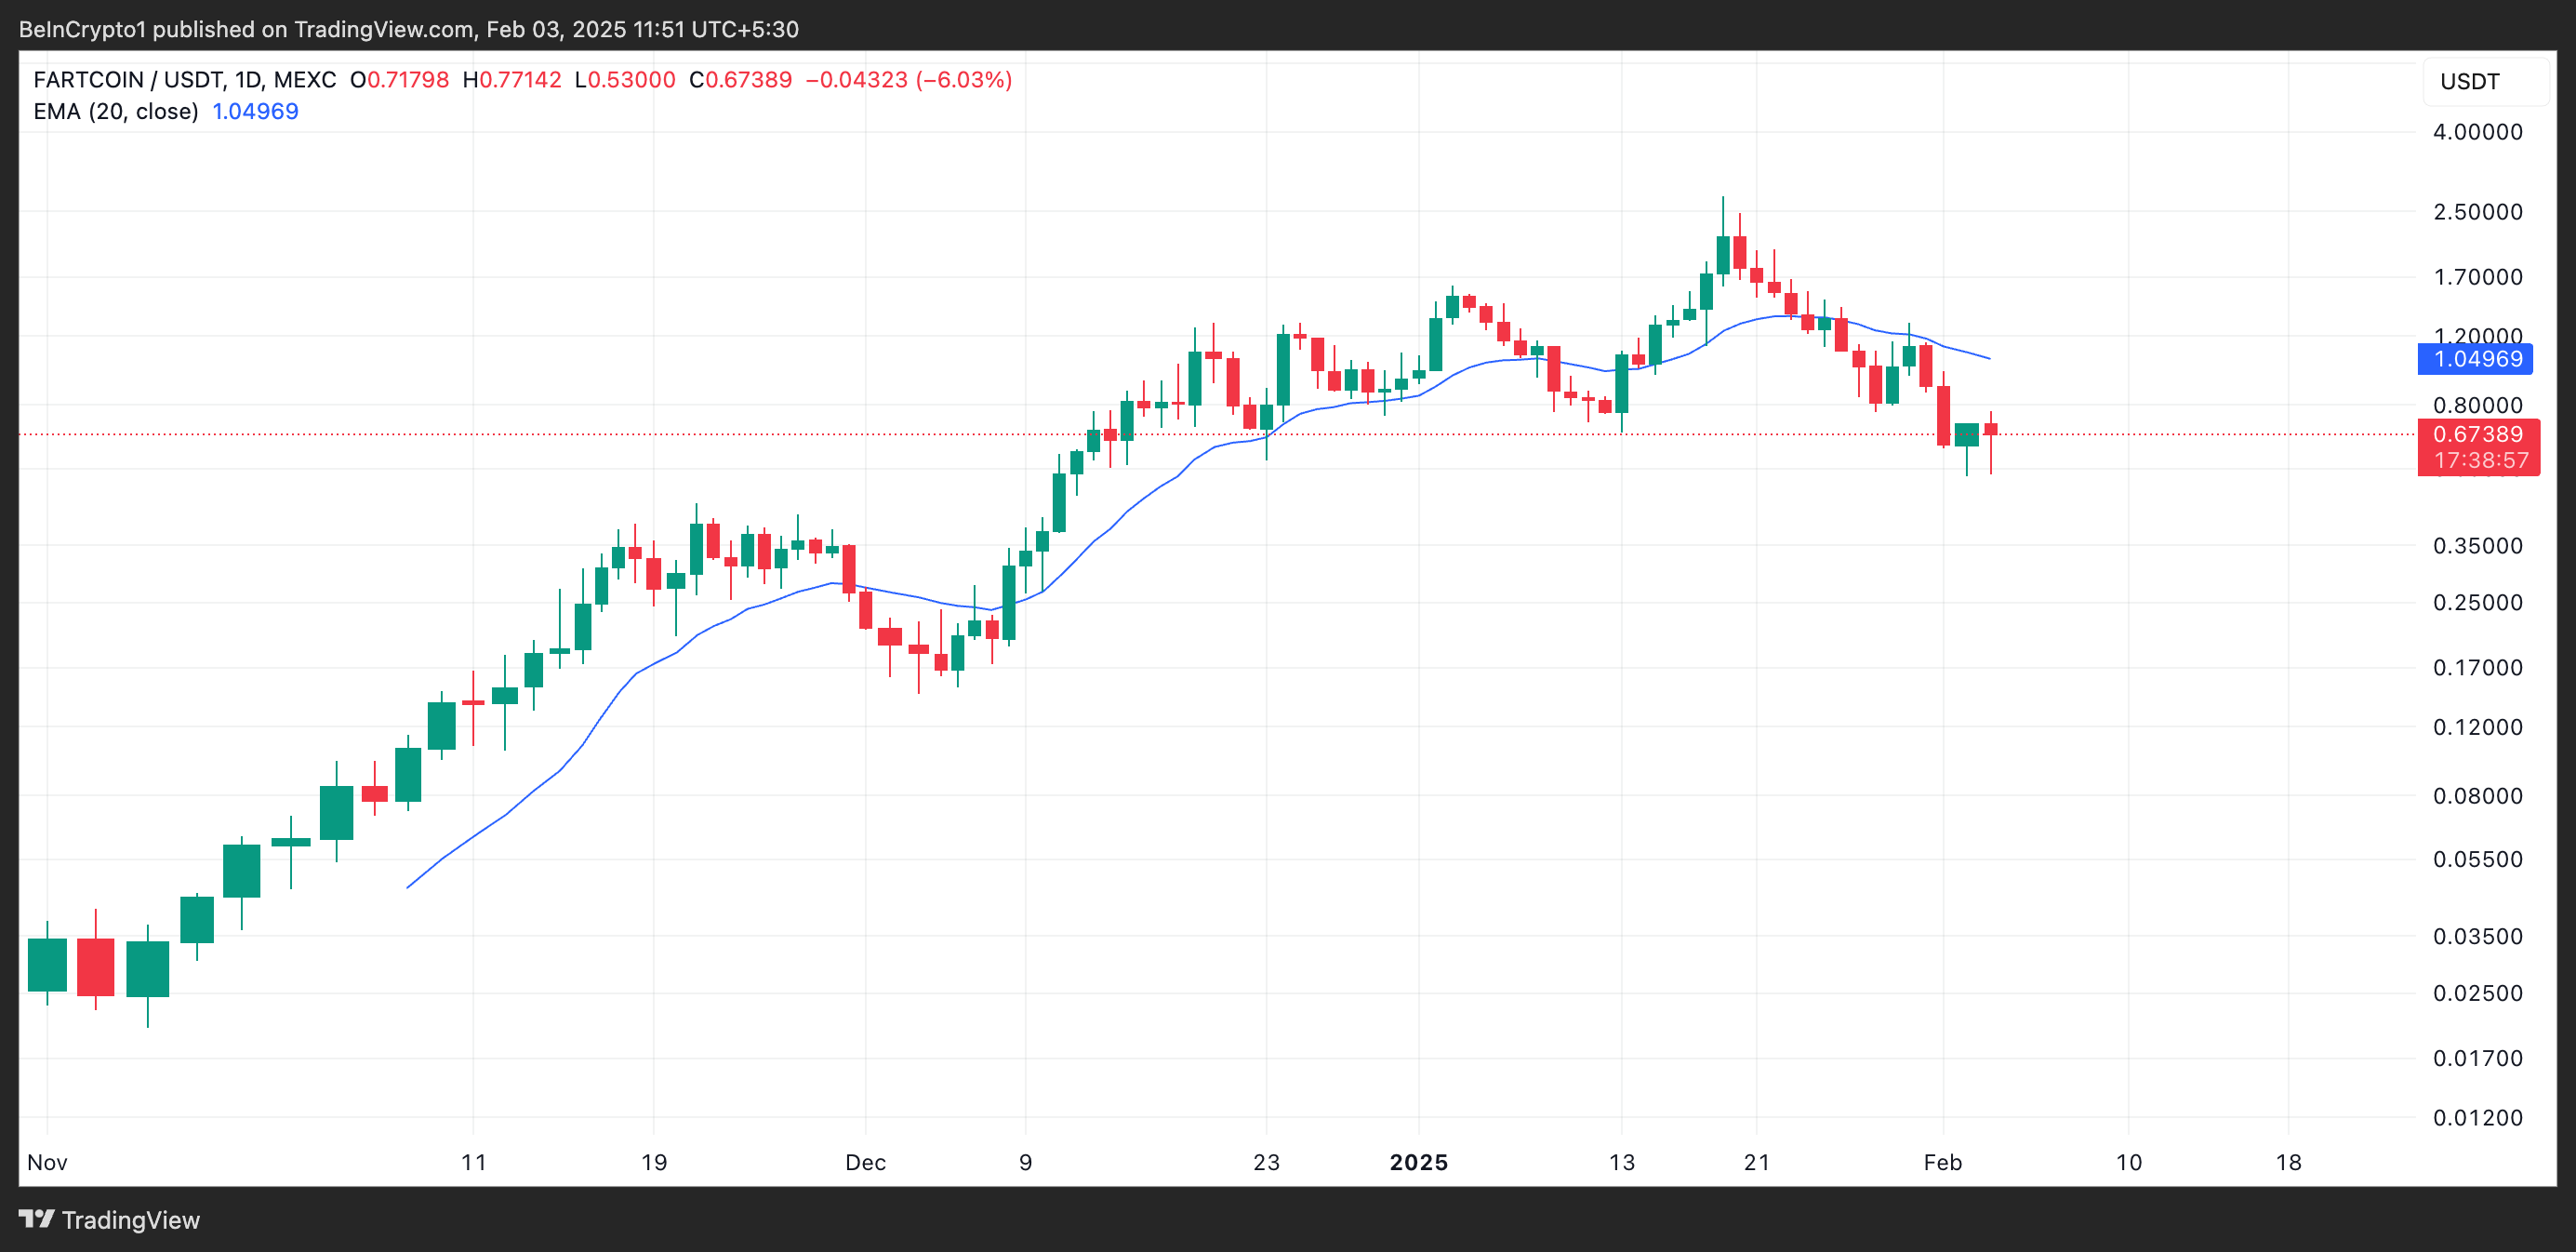
An asset’s 20-day EMA measures its average trading price over the past 20 days, giving more weight to recent prices to better reflect short-term trends. When an asset’s price falls below this key moving average, it signals weakening momentum and a bearish shift. This suggests that $FARTCOIN’s selling pressure is increasing, and unless demand picks up, the asset could continue declining.
Additionally, $FARTCOIN’s falling Relative Strength Index (RSI) reflects the waning buying activity in the market. At press time, its RSI stands at 40.22.
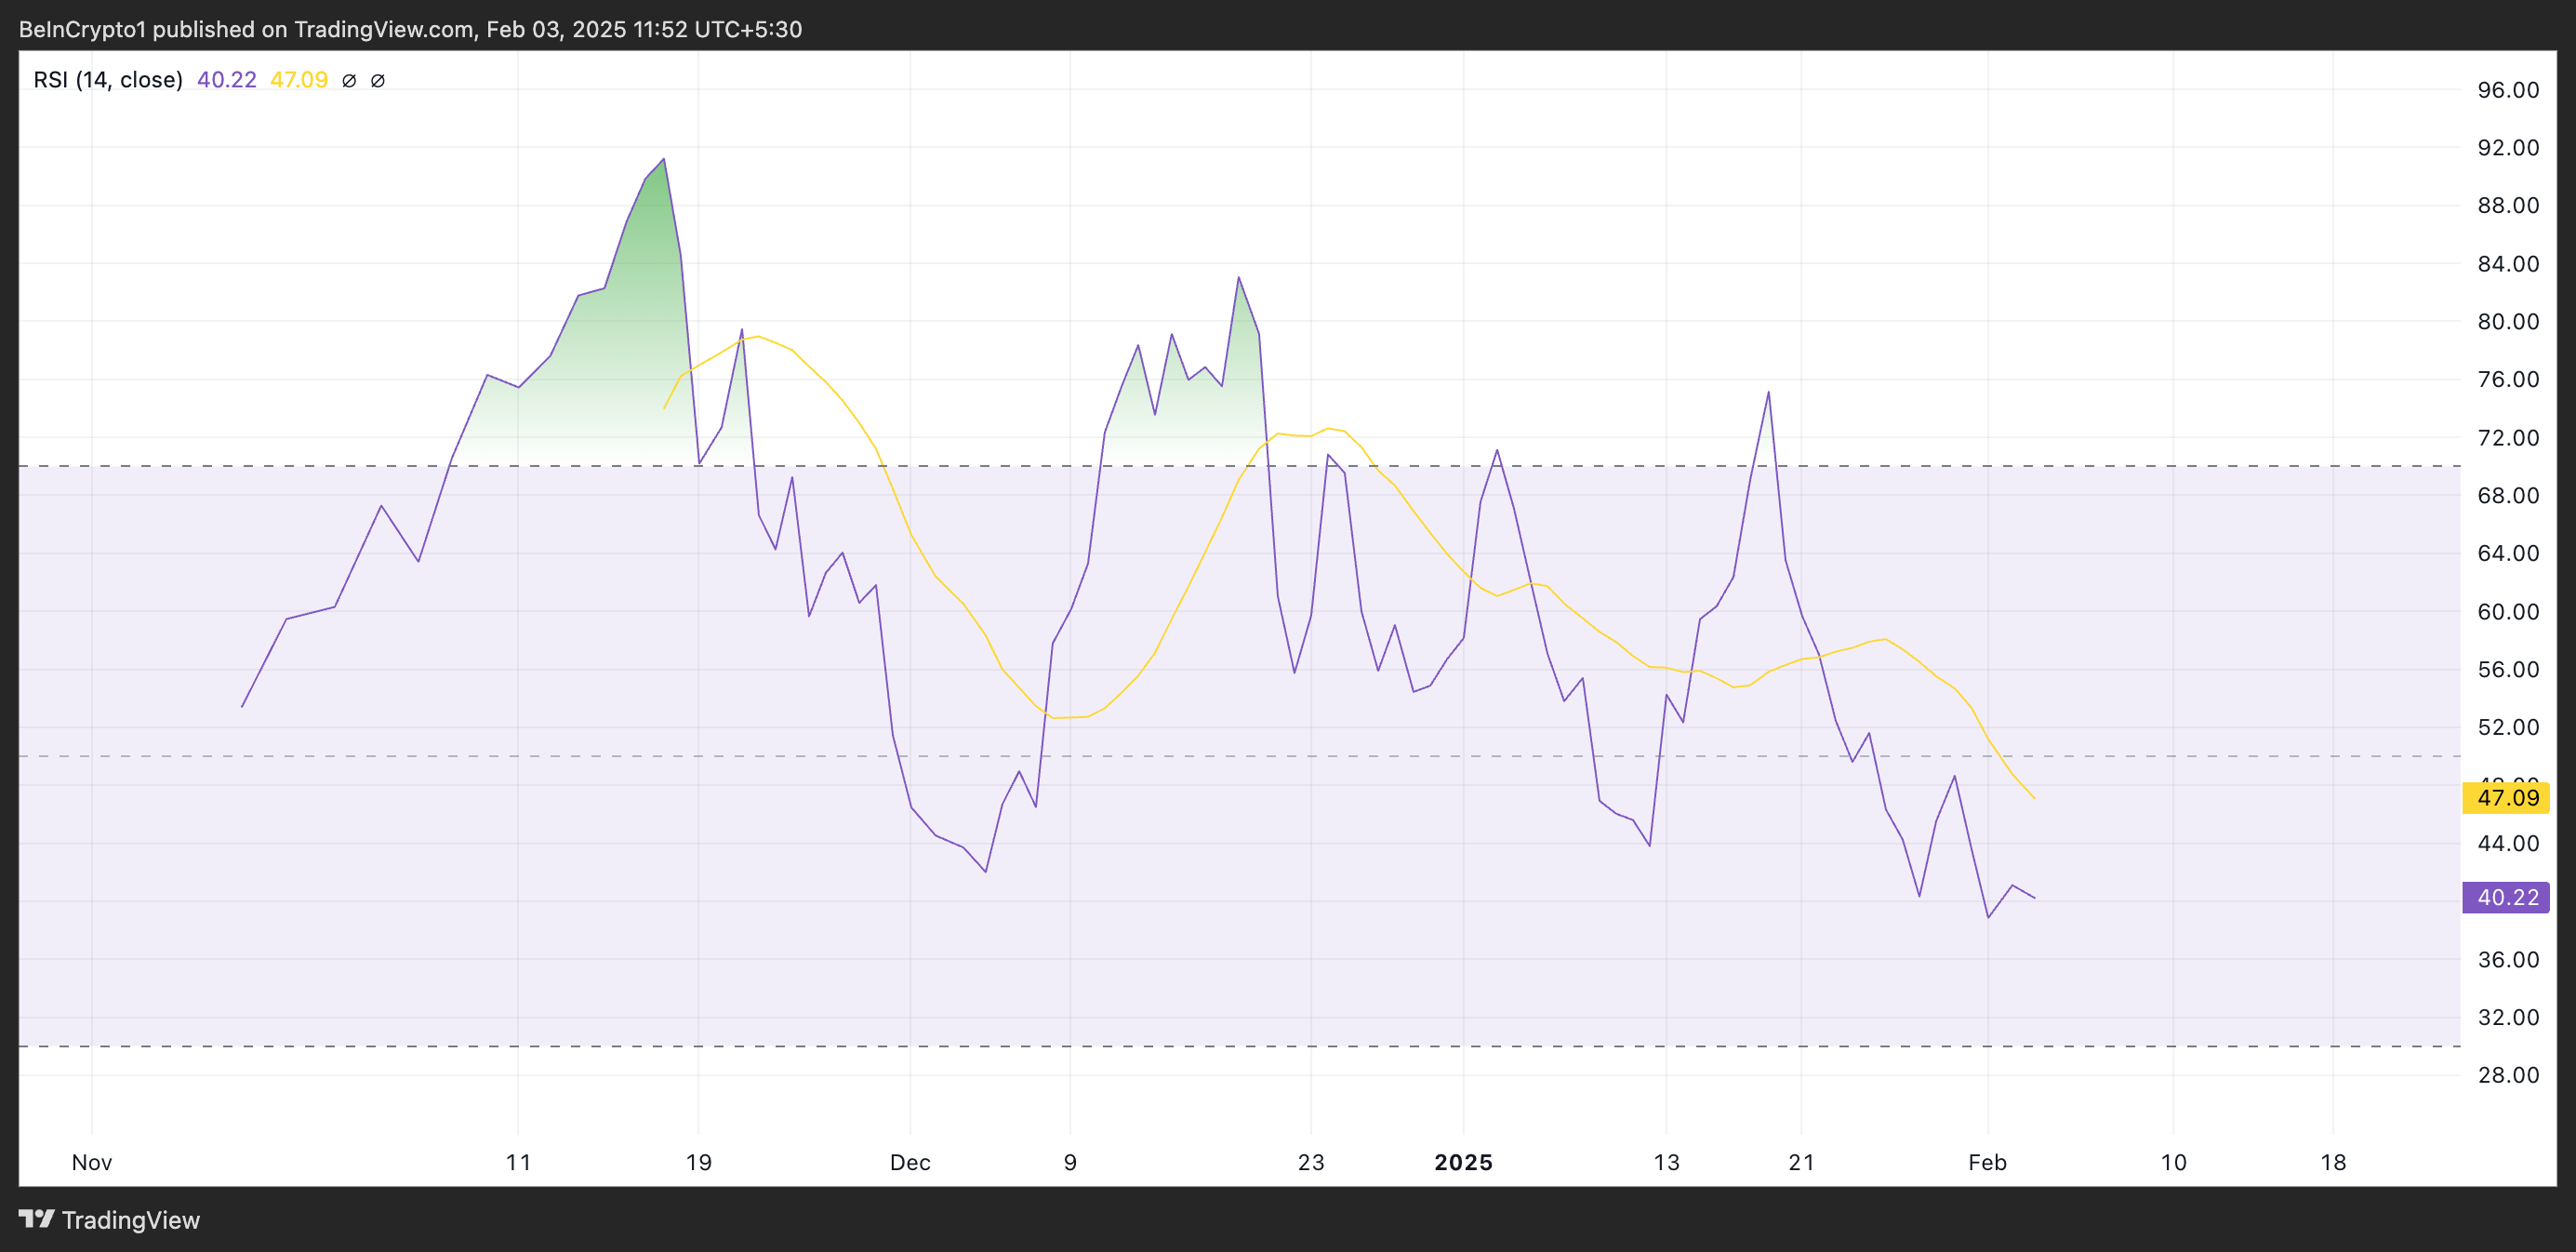
This momentum indicator measures an asset’s oversold and overbought market conditions. It ranges between 0 and 100, with values above 70 suggesting that the asset is overbought and due for a correction. On the other hand, values under 30 indicate that the asset is oversold and may witness a rebound.
At 40.22, $FARTCOIN’s RSI indicates that the asset is in a bearish zone but not yet oversold, suggesting weakening momentum and increased selling pressure.
$FARTCOIN Price Prediction: Will It Sink or Surge?
Readings from $FARTCOIN’s Fibonacci Retracement tool suggest that the Solana-based meme coin risks falling to a two-month low of $0.14 if buying activity remains subdued. The token last traded at this low on December 3.
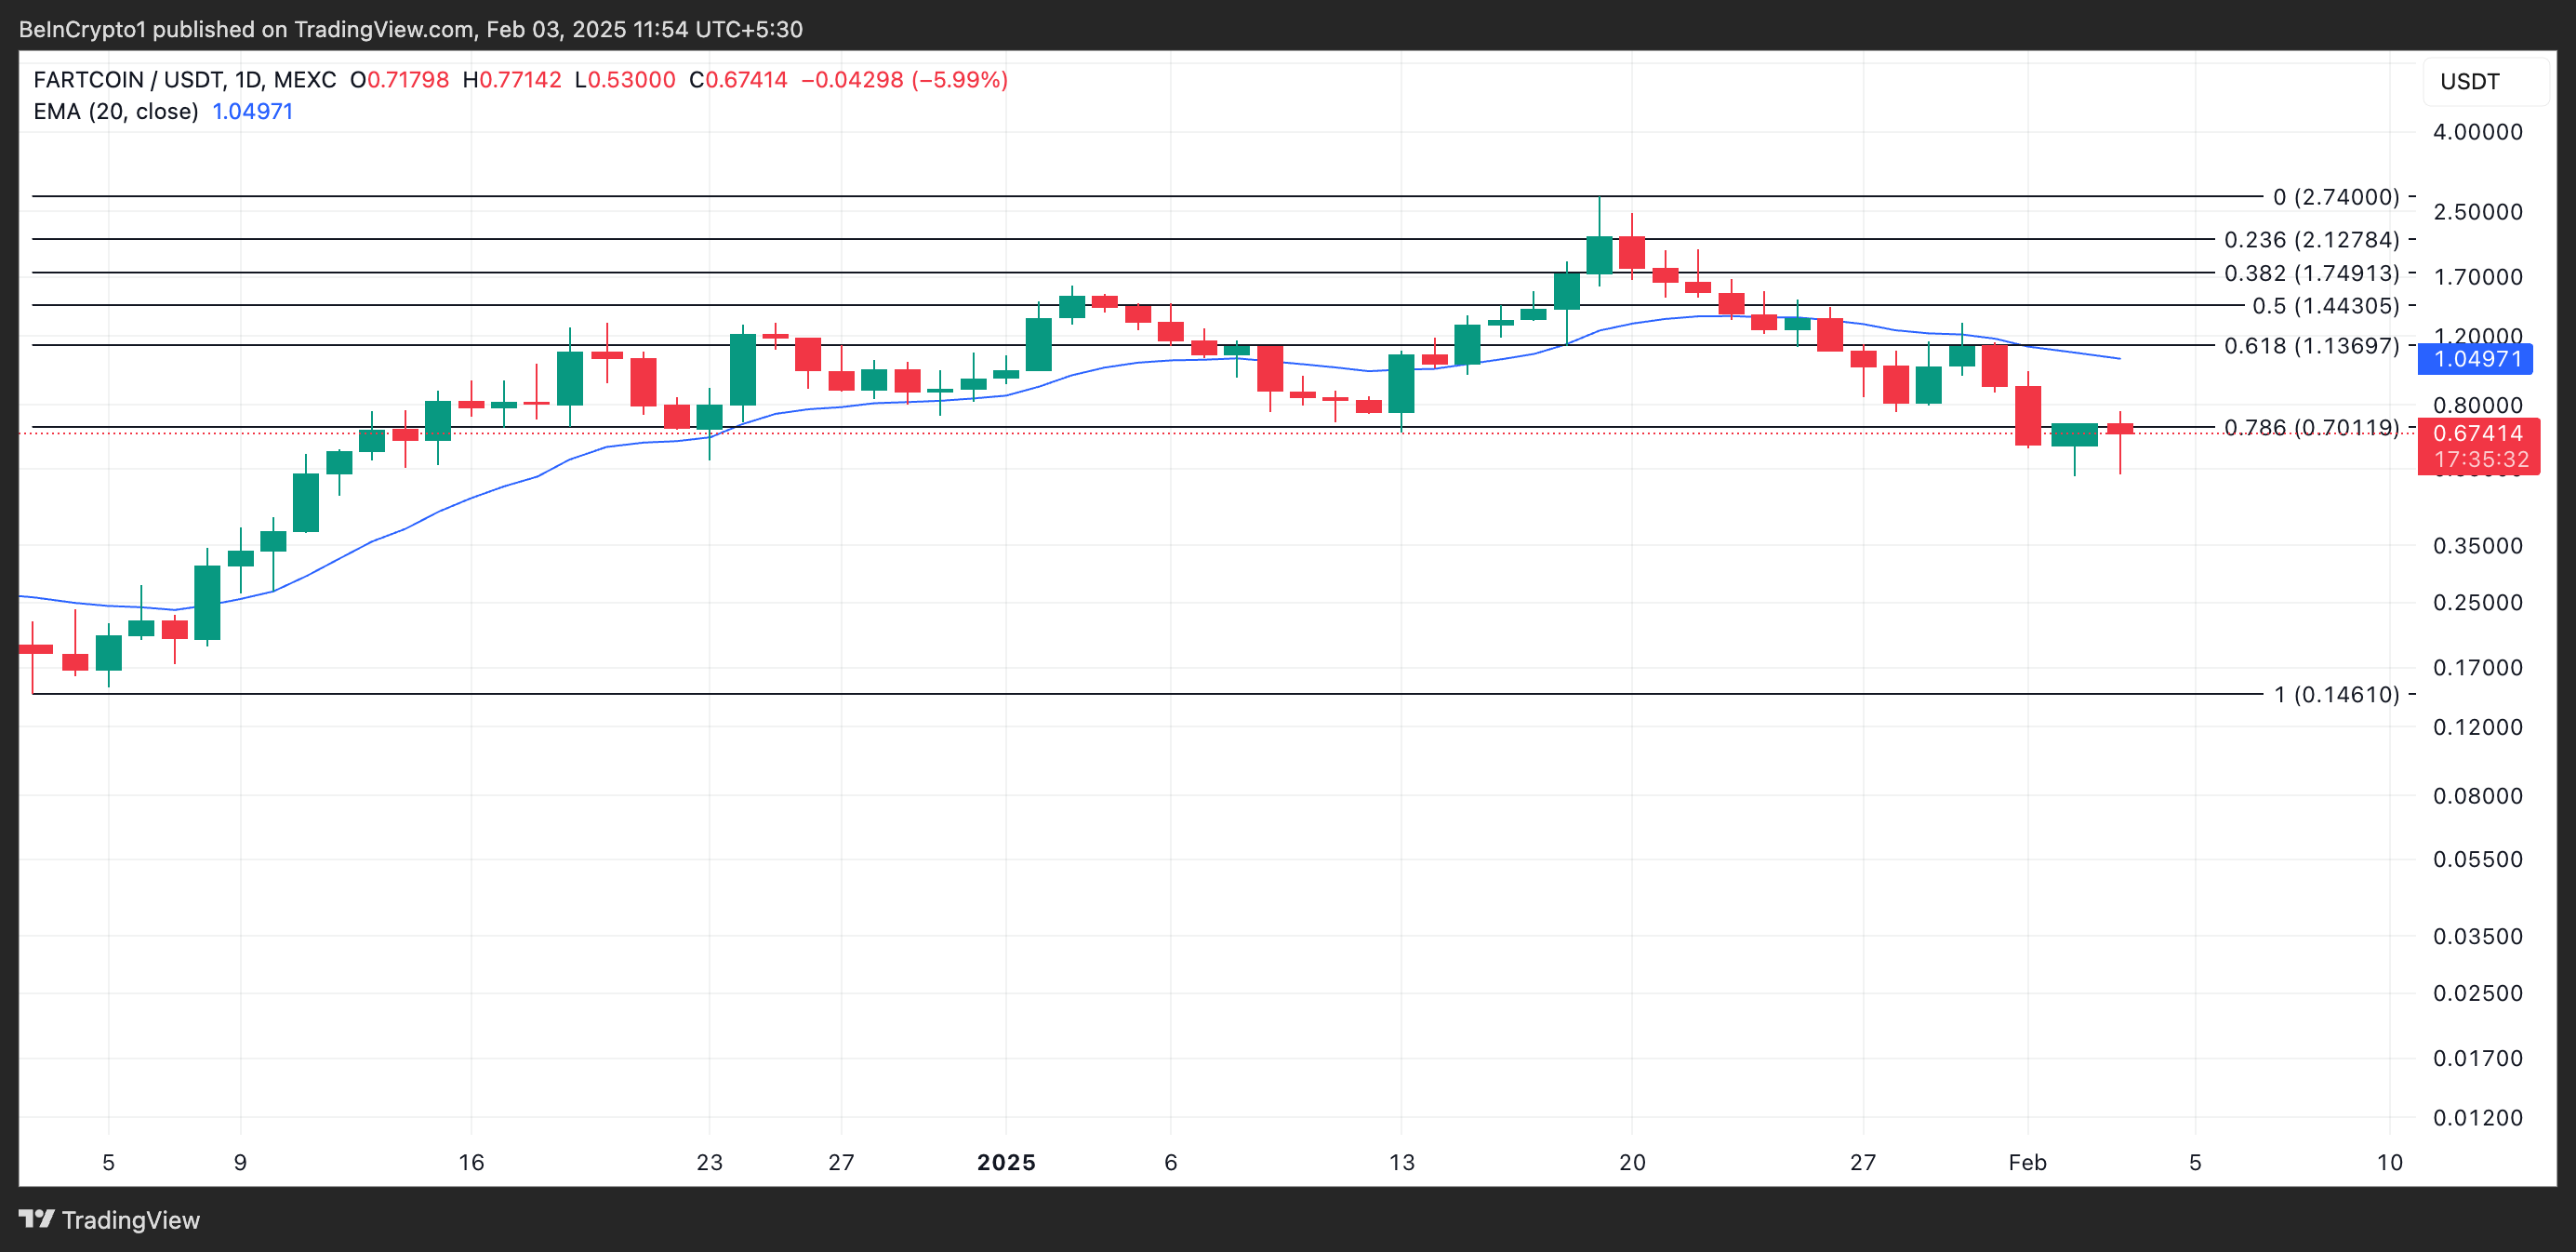
However, if market sentiment shifts and buyers increase demand for $FARTCOIN, they could push its price above the 20-day EMA dynamic resistance at $1.04 and toward $1.13.