
Hyperliquid ($HYPE) price has dropped nearly 16% in the last 24 hours, bringing its market cap down to $7.4 billion. Technical indicators suggest that sellers are gaining control, with Directional Movement Index (DMI) and BBTrend both weakening.
The EMA lines are also showing signs of a potential death cross, which could accelerate losses if key support at $21.1 fails. However, if buyers step in and momentum shifts, $HYPE could rebound toward $24.39, with a breakout potentially pushing it to $27.
$HYPE DMI Chart Shows Sellers Are In Control
Hyperliquid Directional Movement Index (DMI) chart shows a significant shift in momentum, with its Average Directional Index (ADX) rising to 20.3 from 9 in just four days.
The ADX measures trend strength on a scale from 0 to 100, where values below 20 indicate a weak trend, and readings above 25 suggest a stronger trend is forming. This recent increase suggests that $HYPE’s ongoing downtrend may be gaining strength, but it’s still in the early stages of confirmation.
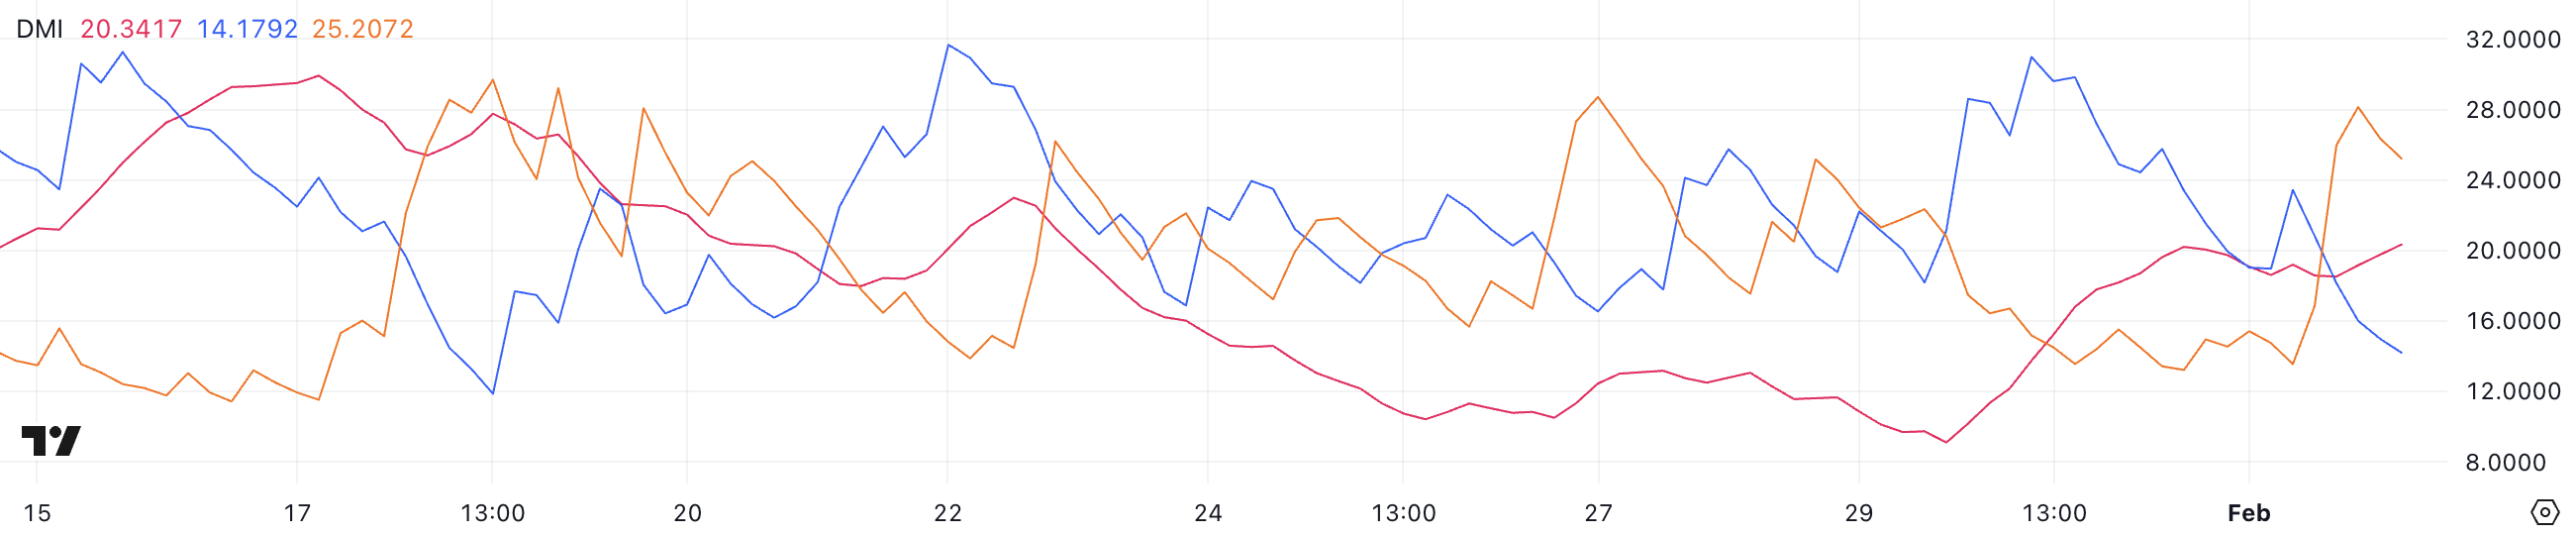
The +DI (Positive Directional Indicator) has dropped sharply from 30.9 to 14.1, while the -DI (Negative Directional Indicator) has surged from 13.5 to 25.2, signaling a shift in momentum toward the downside.
Since -DI is now above +DI, sellers are currently in control, reinforcing $HYPE bearish trend. If ADX continues rising above 25, it would confirm a stronger downtrend, meaning further losses could be ahead unless buyers regain momentum.
BBTrend Is Still Positive, But Going Down
$HYPE BBTrend has dropped significantly from 10.1 yesterday to 3.15 today, signaling a weakening bullish momentum. BBTrend (Bollinger Band Trend) measures the strength of a price trend based on Bollinger Bands, where positive values suggest an uptrend and negative values indicate a downtrend.
The higher the BBTrend value, the stronger the trend in that direction. While $HYPE’s BBTrend remains positive, its sharp decline suggests that buying pressure is fading.
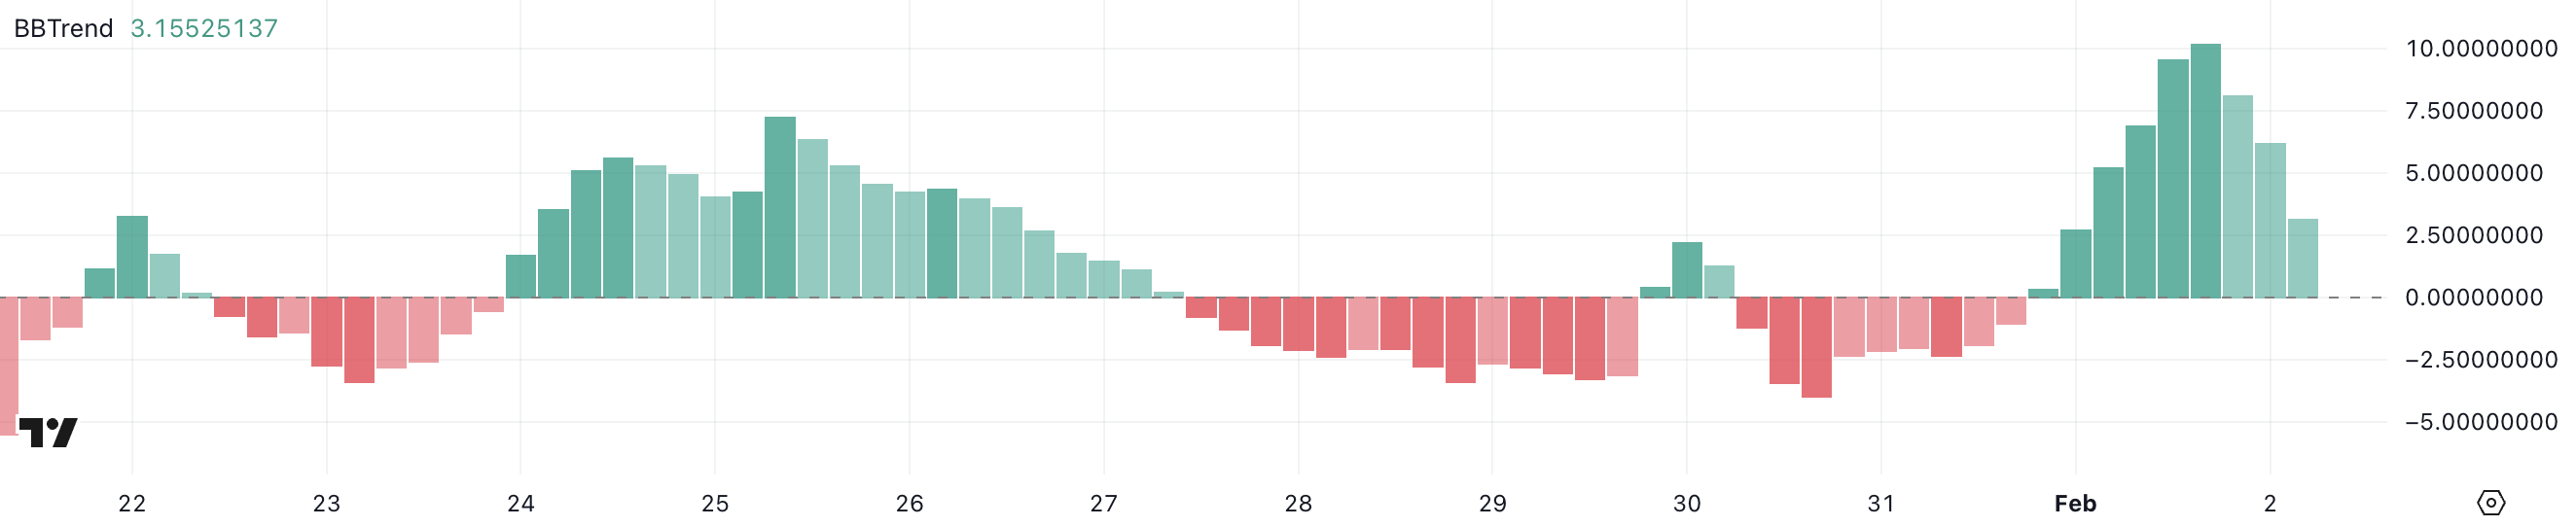
With BBTrend falling quickly, $HYPE’s price momentum is slowing, increasing the risk of a potential reversal or deeper pullback. If the BBTrend turns negative, it could confirm a shift into a downtrend.
However, if buyers step in and stabilize the trend, $HYPE price could attempt to regain bullish strength. The next few sessions will be crucial in determining whether this decline is a temporary dip or the start of a broader correction.
$HYPE Price Prediction: Will $HYPE Fall Below $20 Soon?
Hyperliquid Exponential Moving Average (EMA) lines indicate a crucial turning point, as short-term EMAs are still above long-term ones but are declining quickly.
If they cross below—a death cross—it would signal a stronger bearish trend. In that case, $HYPE could test key support at $21.1. If that level breaks, further downside could push prices to $20.1 or even $18.89, the lowest level since January 13. This scenario would confirm increasing selling pressure and a prolonged downtrend.
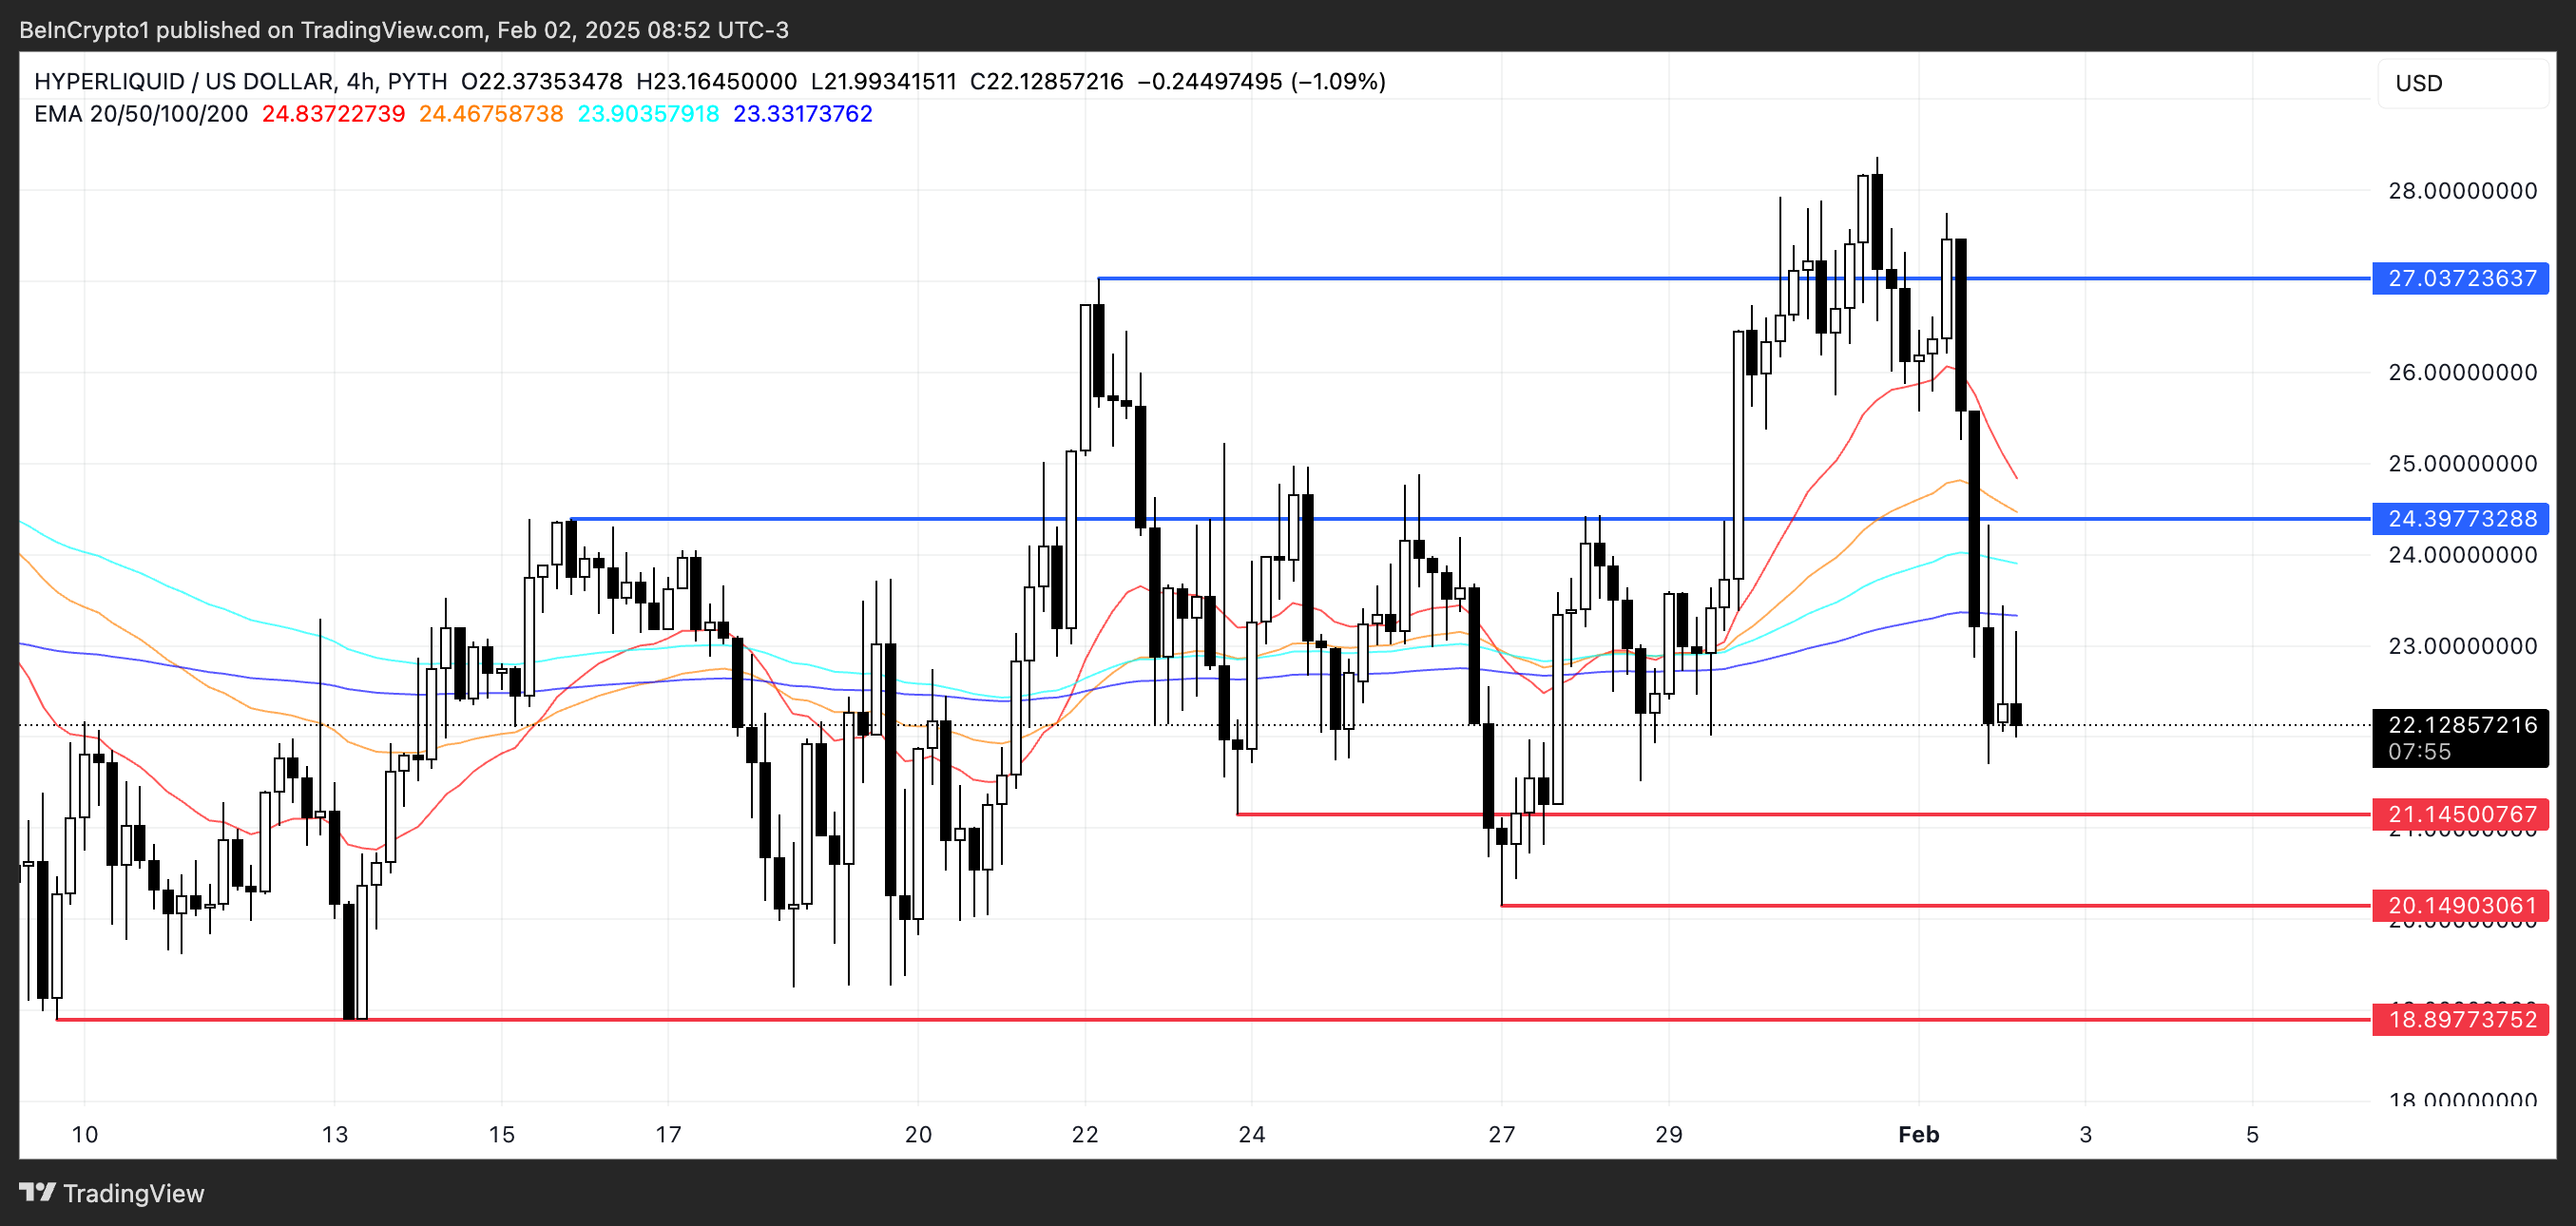
However, if $HYPE price holds above support and momentum shifts, it could attempt a trend reversal.
A rebound from current levels might lead to a test of the $24.39 resistance, and breaking that could push the price toward $27.