
Cryptocurrencies recorded notable upsurges over the past day as Bitcoin hovered above $105,000.
While top altcoins such as Sui (+12%) and LINK (+6%) mirror the bullish trends, Hyperliquid’s native $HYPE stole the show with significant gains on its 24-hour chart.
$HYPE surged by over 17% from a daily low of $22.14 to surpass $26.
The substantial jump propelled the alt’s price past the 20-day EMA crucial resistance.
The hurdle, which coincides with $23.12, has prevented $HYPE upswings since the US inauguration-triggered slides.
Furthermore, the digital coin has flipped the resistance to support, confirming a decisive trend shift and possibilities of continued rallies.
$HYPE turns crucial hurdle to support
The 1D chart shows Hyperliquid’s altcoin changing hands above the 20-day Exponential Moving Average.
The EMA measures the token’s average price within the past twenty days to determine the weight of current trends.
A move past the 20-day EMA confirms momentum change, often suggesting a bullish comeback.
$HYPE changes hands at $26.14, with the resistance-turned-support offering a Launchpad for significant uptrends.
Surging demand supports an upside trajectory
$HYPE’s gains coincide with demand resurgence, which amplifies its bullish stance.
The Chaikin Money Flow has maintained steady uptrends since bouncing from -0.14 on January 27 to +0.27 at press time.
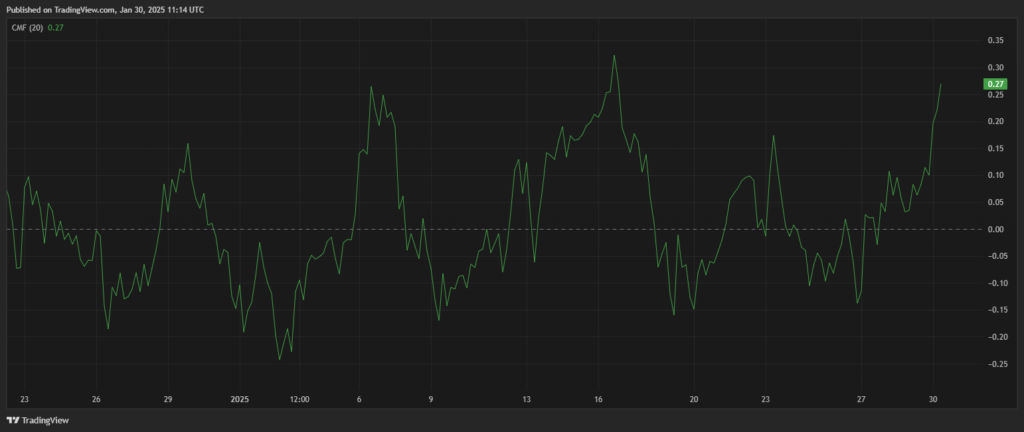
That confirms renewed accumulations and a trend shift to bullishness.
The CMF measures money entering and leaving an asset’s ecosystem.
Values beyond zero demonstrate significant buying momentum, with accumulation eclipses distribution.
Moreover, $HYPE’s price wavers above the Supertrend’s green line on the 4H timeframe, with a dynamic support zone at $21.80.
Traders use the Supertrend indicator to determine the asset’s direction based on its volatility.
Prices above this signal suggest a bullish bias, confirming buyer dominance.
The Moving Average Convergence Divergence highlights the optimistic bias with a bullish crossover with the signal line.
Moreover, the 1D Relative Strength Index, reading 57, suggests room for more $HYPE gains.
The RSI measures the token’s momentum, determining its overbought or oversold conditions at a 0 – 100 scale.
Figures beyond 70 confirm overbought situations and possible retracements, while values below 30 reflect oversold and imminent rebounds.
$HYPE’s RSI highlights more uptrends before the alt hits the overbought region.
$HYPE price outlook: what next
The altcoin trades above $26 after gaining nearly 20% in the past 24 hours.

It boasts impressive bullishness after overcoming the 20-day EMA obstacle.
$HYPE bulls target the resistance at $27.50- beyond which the alt will soar to December 2024 levels above $30.
Such developments will potentially open the gates for Hyperliquid’s ATH at $35.
However, potential profit booking after the latest gains will invalidate the upside journey.
$HYPE could plunge towards the $23.12 support before extending to $18.50 – a 40% plunge from current prices.
The post Hyperliquid price prediction: $HYPE breaks resistance as demand skyrockets appeared first on Invezz