
During Monday’s trading session, the $SUI price projected a slight uptick of 1.3% jump to reach a trading price of $1.36. The bullish turnaround likely followed broader market sentiment as the U.S. Federal Reserve confirmed maintaining the federal funds rate at 4.25% to $4.5%. While the crypto market is yet to prolong the bottom formation of the current correction, assets like $SUI stand as major support levels to interest crypto investors.
Key Highlights:
- The $SUI price wavering above 38.2% and the 50% Fibonacci retracement level indicates a health pullback for market buyers..
- An ascending trendline is a daily chart that drives the current uptrend.
- A 20% in TVL indicates that investors and liquidity providers may be exiting the $SUI ecosystem.
DeFi Activity on $SUI Network Declines as TVL Drops
According to DeFiLlama data, the $SUI networks’ total volume locked has significantly dropped from $2.06 to $1.65— a 20% decrease in the last three weeks. The declining TVL often indicates that investors and liquidity providers are withdrawing funds, potentially signaling waning confidence in the $SUI ecosystem.
Lower TVL suggests a drop in DeFI participation, which could notably impact the native cryptocurrency $SUI.
$SUI Price Tests Critical Fibonacci Levels
Amid the broader market uncertainty, the $SUI price formed a local top at $5.36 level in early January. The bearish turnaround has plunged the asset over 30% to trade at $3.7.
The falling price, accompanied by a surge in trading volume, hints at higher conviction from sellers to prolong this correction. Currently, the $SUI price seeks support at the 38.2% Fibonacci retracement level, while the next major support is at $2.9, coinciding with 50% FIB..
Theoretically, these Fibonacci levels show healthy retracement levels for an asset to recuperate the exhausted bullish momentum.
The daily chart analysis also displays the current uptrend trajectory in the $SUI price with an ascending trendline acting as a dynamic support. These aforementioned levels would be curricula for $SUI to maintain its bullish trend.
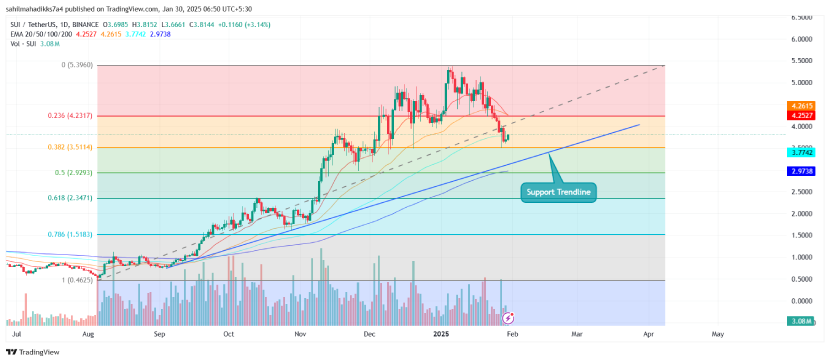
Thus, a potential breakdown below these will accelerate the selling pressure and drive an extended correction below $3.