
Hyperliquid ($HYPE) price has surged over 13% in the past 24 hours, pushing its market cap back above $8 billion to $8.63 billion and securing its position as the 22nd largest crypto.
With trading volume up nearly 40% to almost $300 million, $HYPE’s price has broken above $25 for the first time since January 7. As momentum builds, traders are closely watching key resistance and support levels to gauge $HYPE’s next potential move.
$HYPE DMI Confirms Buyers Are Dominating the Market
Hyperliquid Directional Movement Index (DMI) chart shows an ADX value of 22.5, up from 17.9 just a day ago, signaling a strengthening trend. The ADX measures the strength of a trend without indicating its direction.
Values below 20 suggest a weak or absent trend, while values above 25 indicate a strong trend. The ADX’s rise closer to 25 suggests that $HYPE’s current uptrend is gaining momentum.
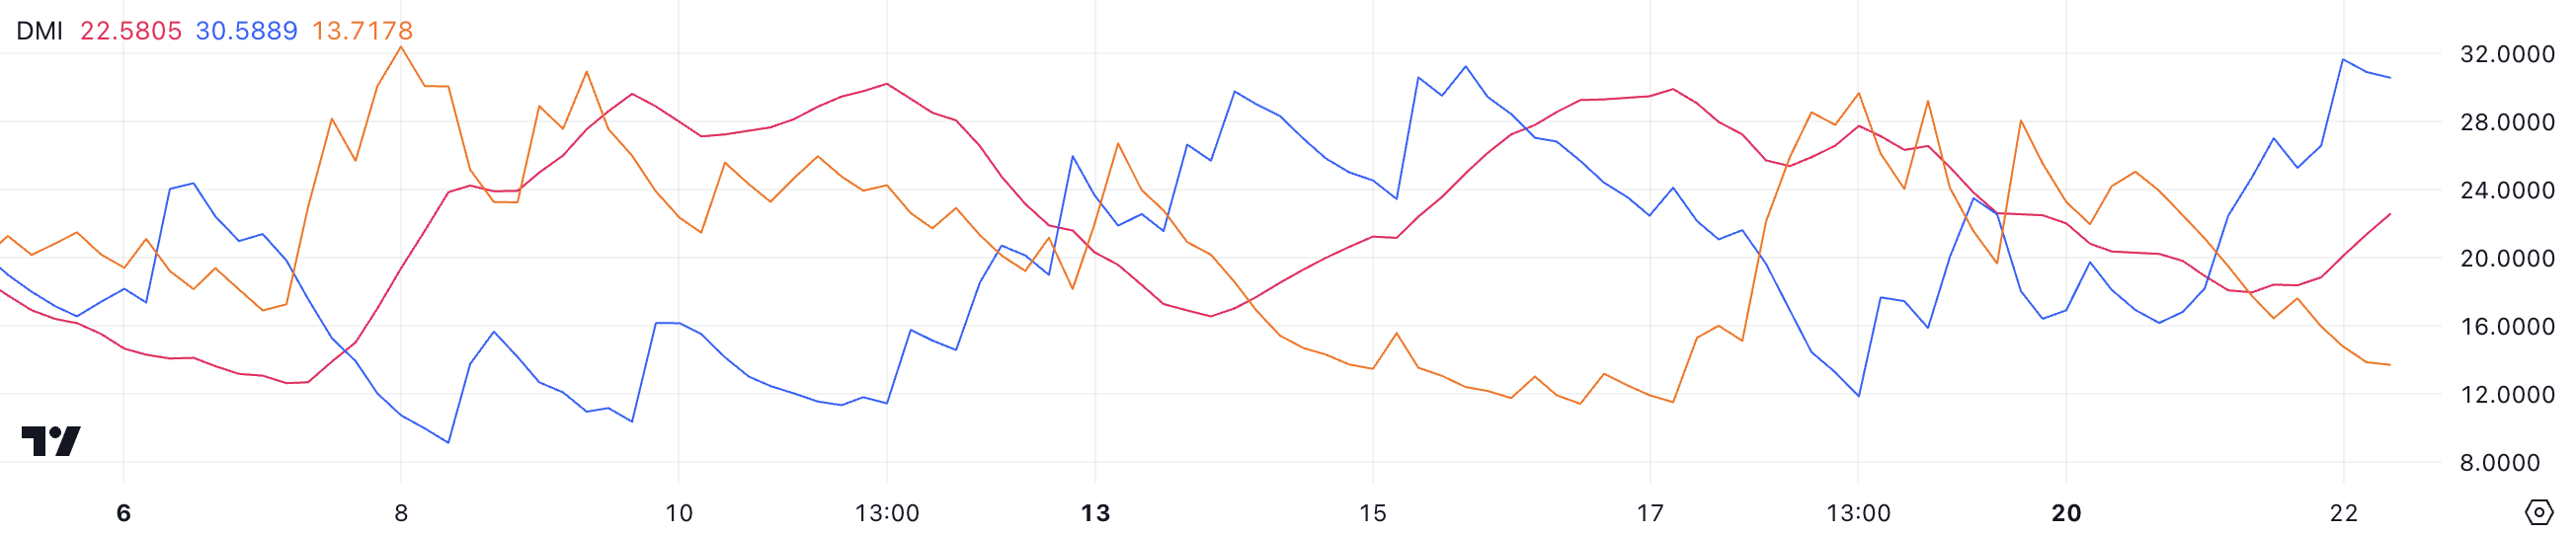
The +DI, which reflects bullish pressure, has risen significantly to 30.5 from 16.1, while the -DI, representing bearish pressure, has dropped to 13.7 from 25. This shift highlights a clear dominance of buyers over sellers, aligning with $HYPE ongoing price recovery from recent lows.
The increasing +DI and declining -DI, combined with a rising ADX, suggest that $HYPE’s uptrend is intact and could potentially strengthen further if these trends continue.
Hyperliquid RSI Remains Below Overbought Territory
$HYPE Relative Strength Index is currently at 62.5, rising sharply after touching 31.4 four days ago and briefly reaching 67 a few hours ago.
This upward movement reflects a significant recovery in momentum, signaling increased buying activity. While the RSI has climbed into bullish territory, it remains below the overbought threshold, showing that $HYPE’s current price action is strong but not excessively overheated.
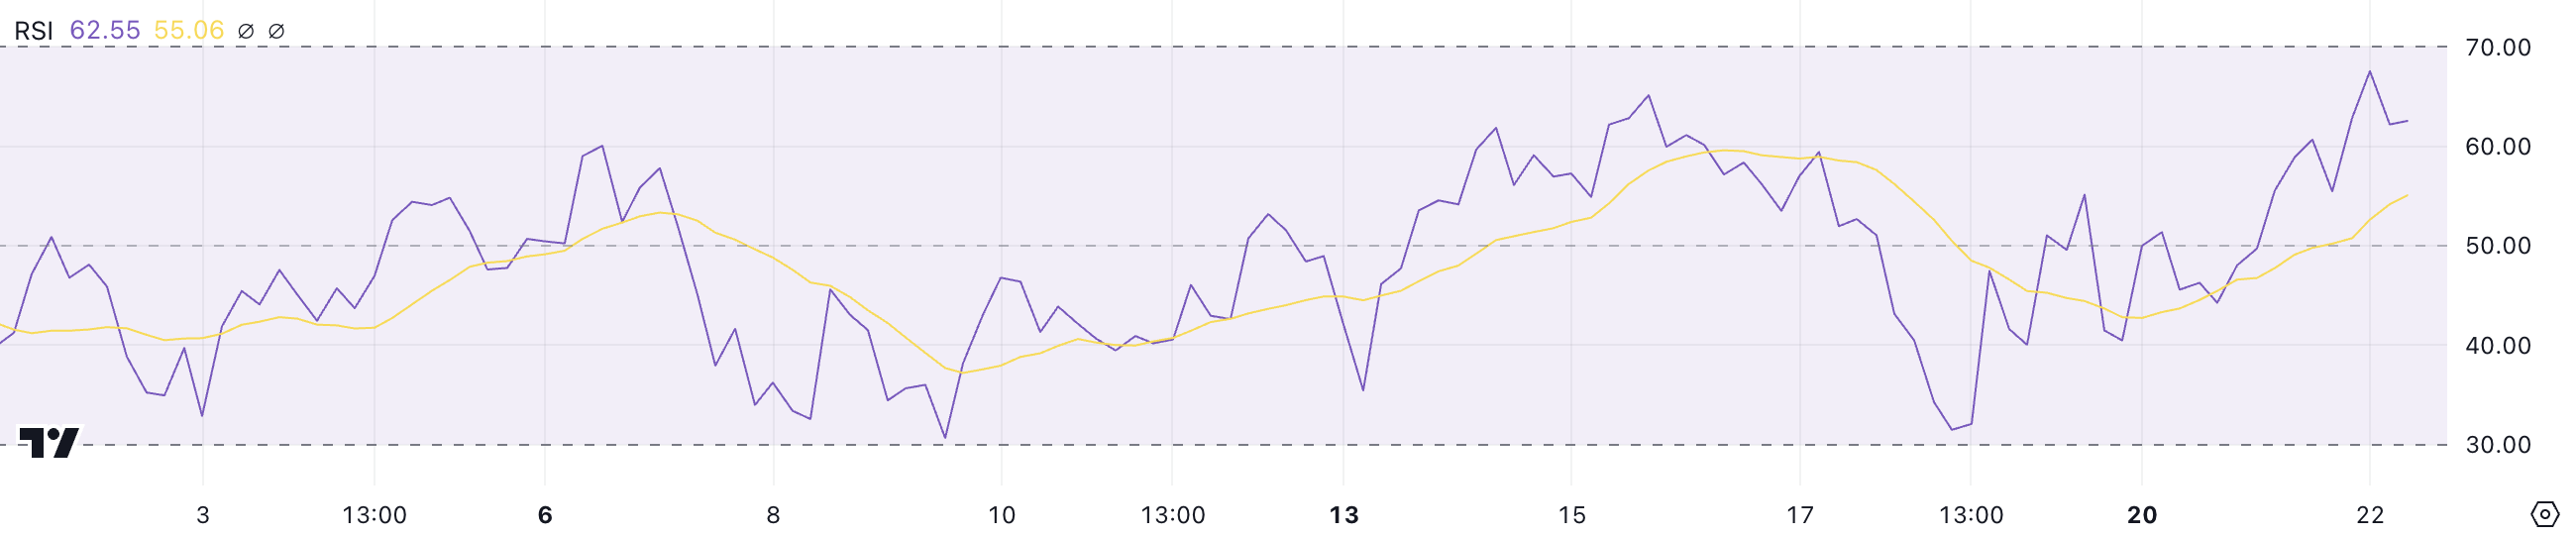
The RSI is a momentum oscillator ranging from 0 to 100, used to assess whether an asset is overbought or oversold. Values above 70 indicate overbought conditions, while values below 30 suggest an oversold state. With $HYPE RSI at 62.5, it suggests bullish sentiment is building, but the price is not yet at risk of a sharp correction.
Since $HYPE RSI has not crossed 70 since mid-December, this level could serve as a psychological resistance; further increases in RSI might point to a sustained uptrend, while a reversal near these levels would indicate caution.
$HYPE Price Prediction: Can It Recover $30 Level This Week?
Hyperliquid recently formed a golden cross, a bullish technical signal where the short-term moving average crosses above the long-term moving average. Following this, its price surged from $22 to $26, reflecting strong momentum. If this positive trend continues, $HYPE price could rise further to test its first resistance at $29.49.
Breaking through this level could open the path to $31.47 and potentially $35, representing a 34.6% upside from its current price.
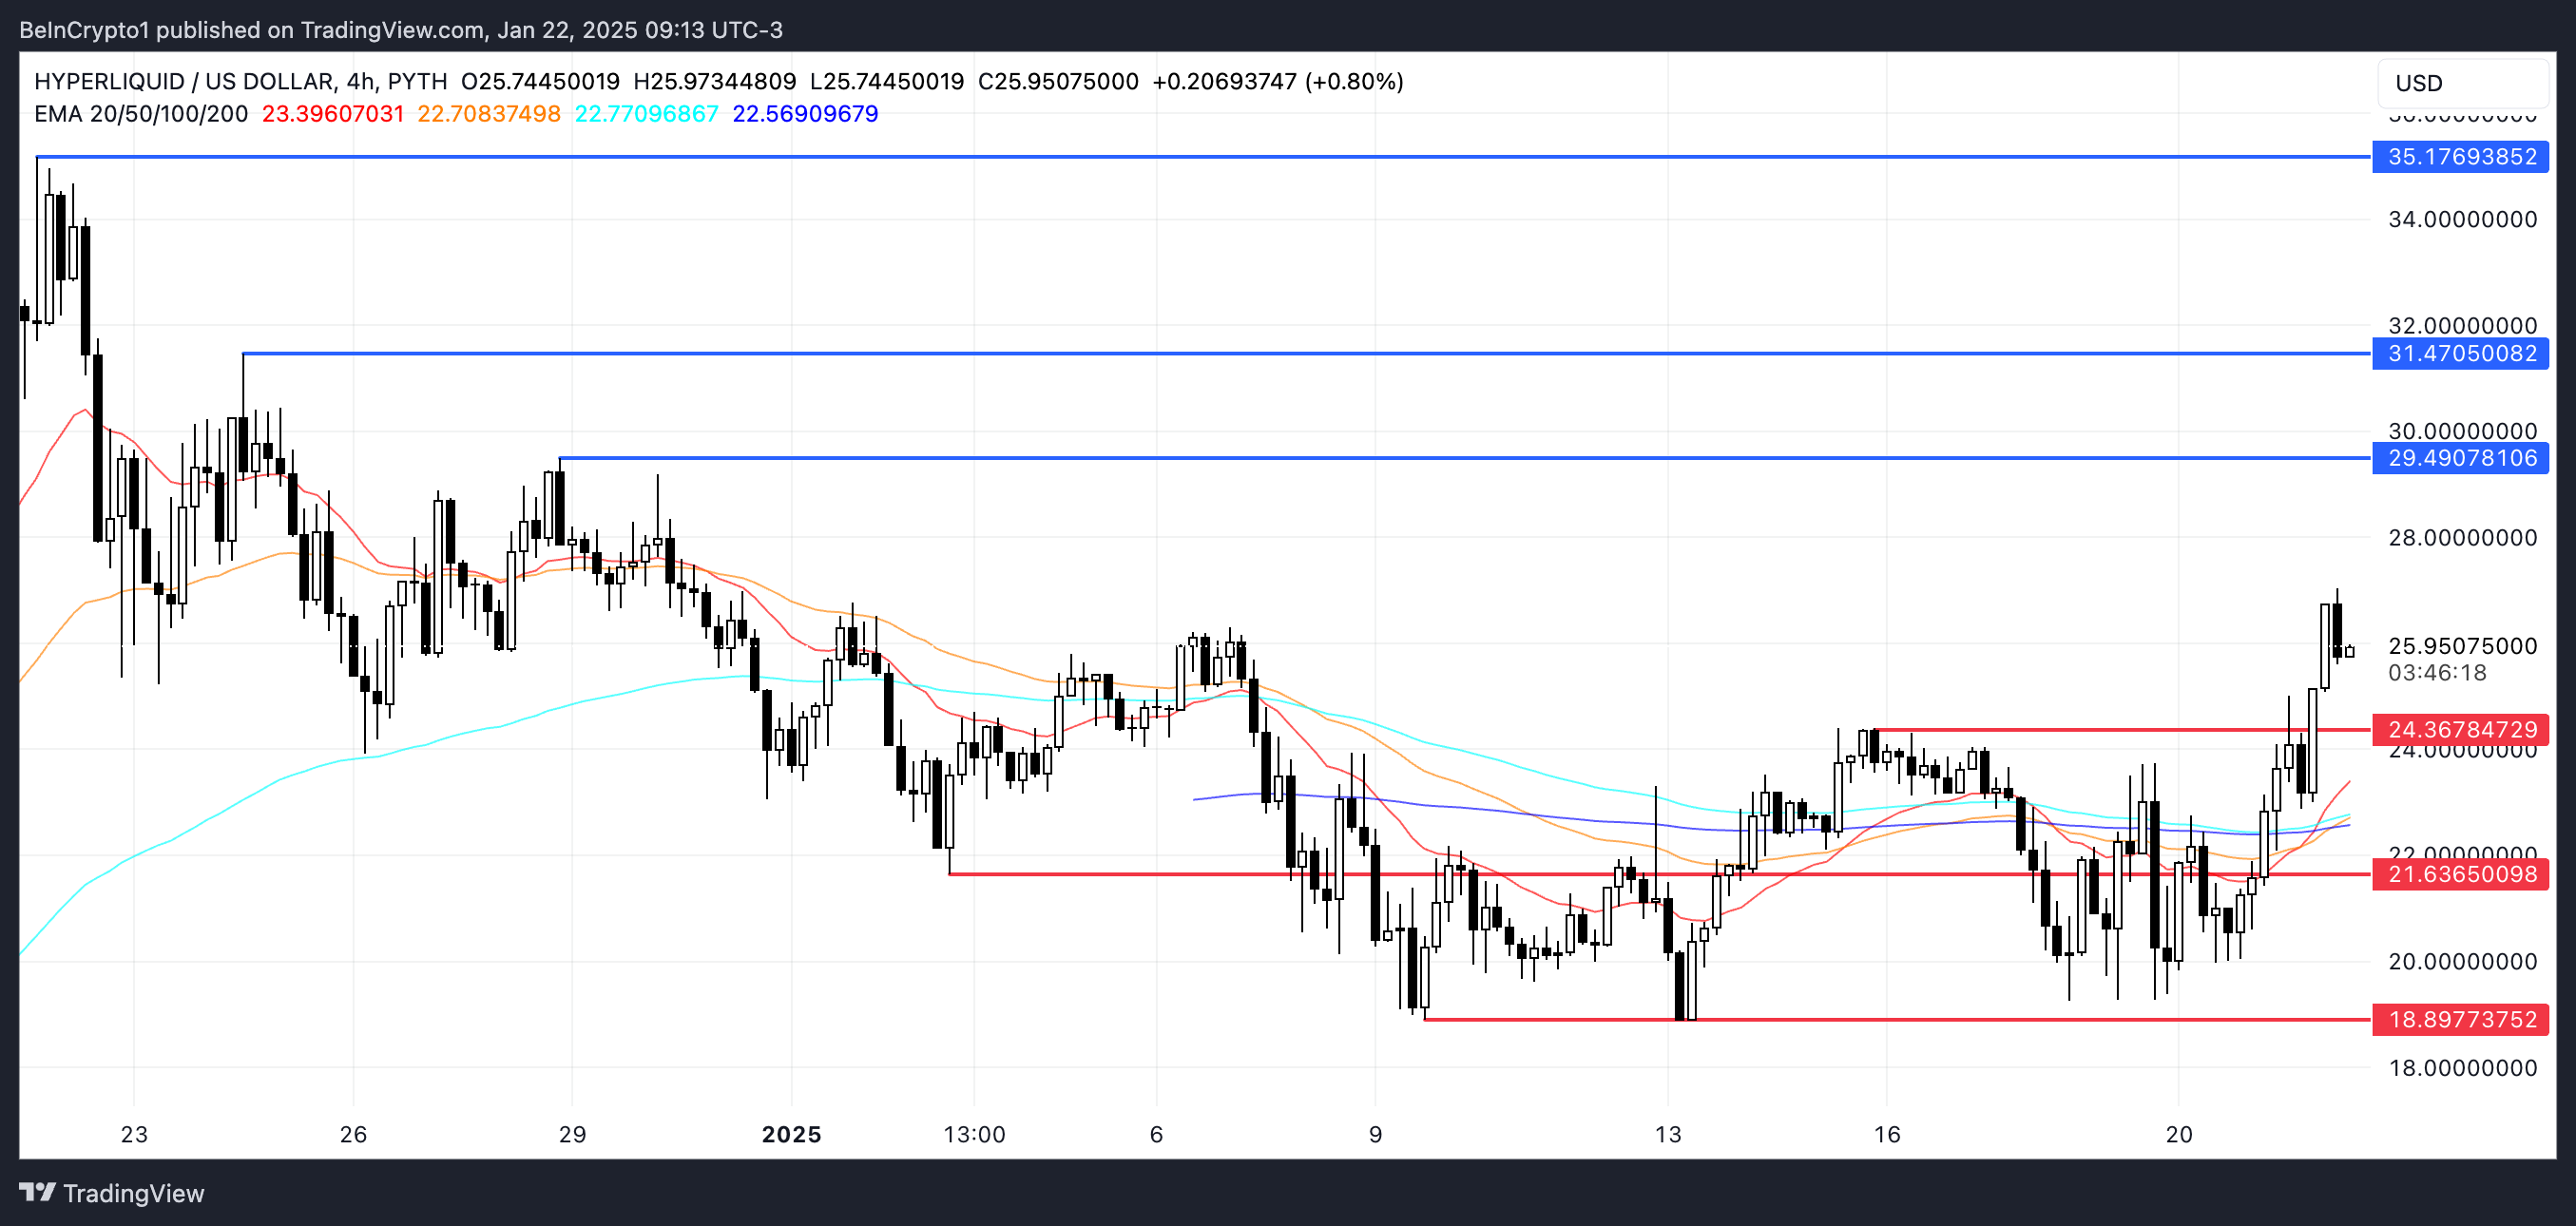
However, if the trend reverses, $HYPE price has a fundamental support level at $24.36, which could act as a key buffer against further declines.
If this support fails, the price might drop to $21.6, and in a more bearish scenario, it could reach as low as $18.89.