XRP’s price is cruising around $3.26 to $3.30 over the last hour, reflecting an 18% gain over the past 24 hours. During this period, trading volume more than doubled to $25.67 billion, while market capitalization swelled to $187.28 billion. The cryptocurrency traded within an intraday range of $2.74 to $3.35, positioning itself just 4-6% shy of its all-time high of $3.40, recorded on Jan. 7, 2018.
XRP
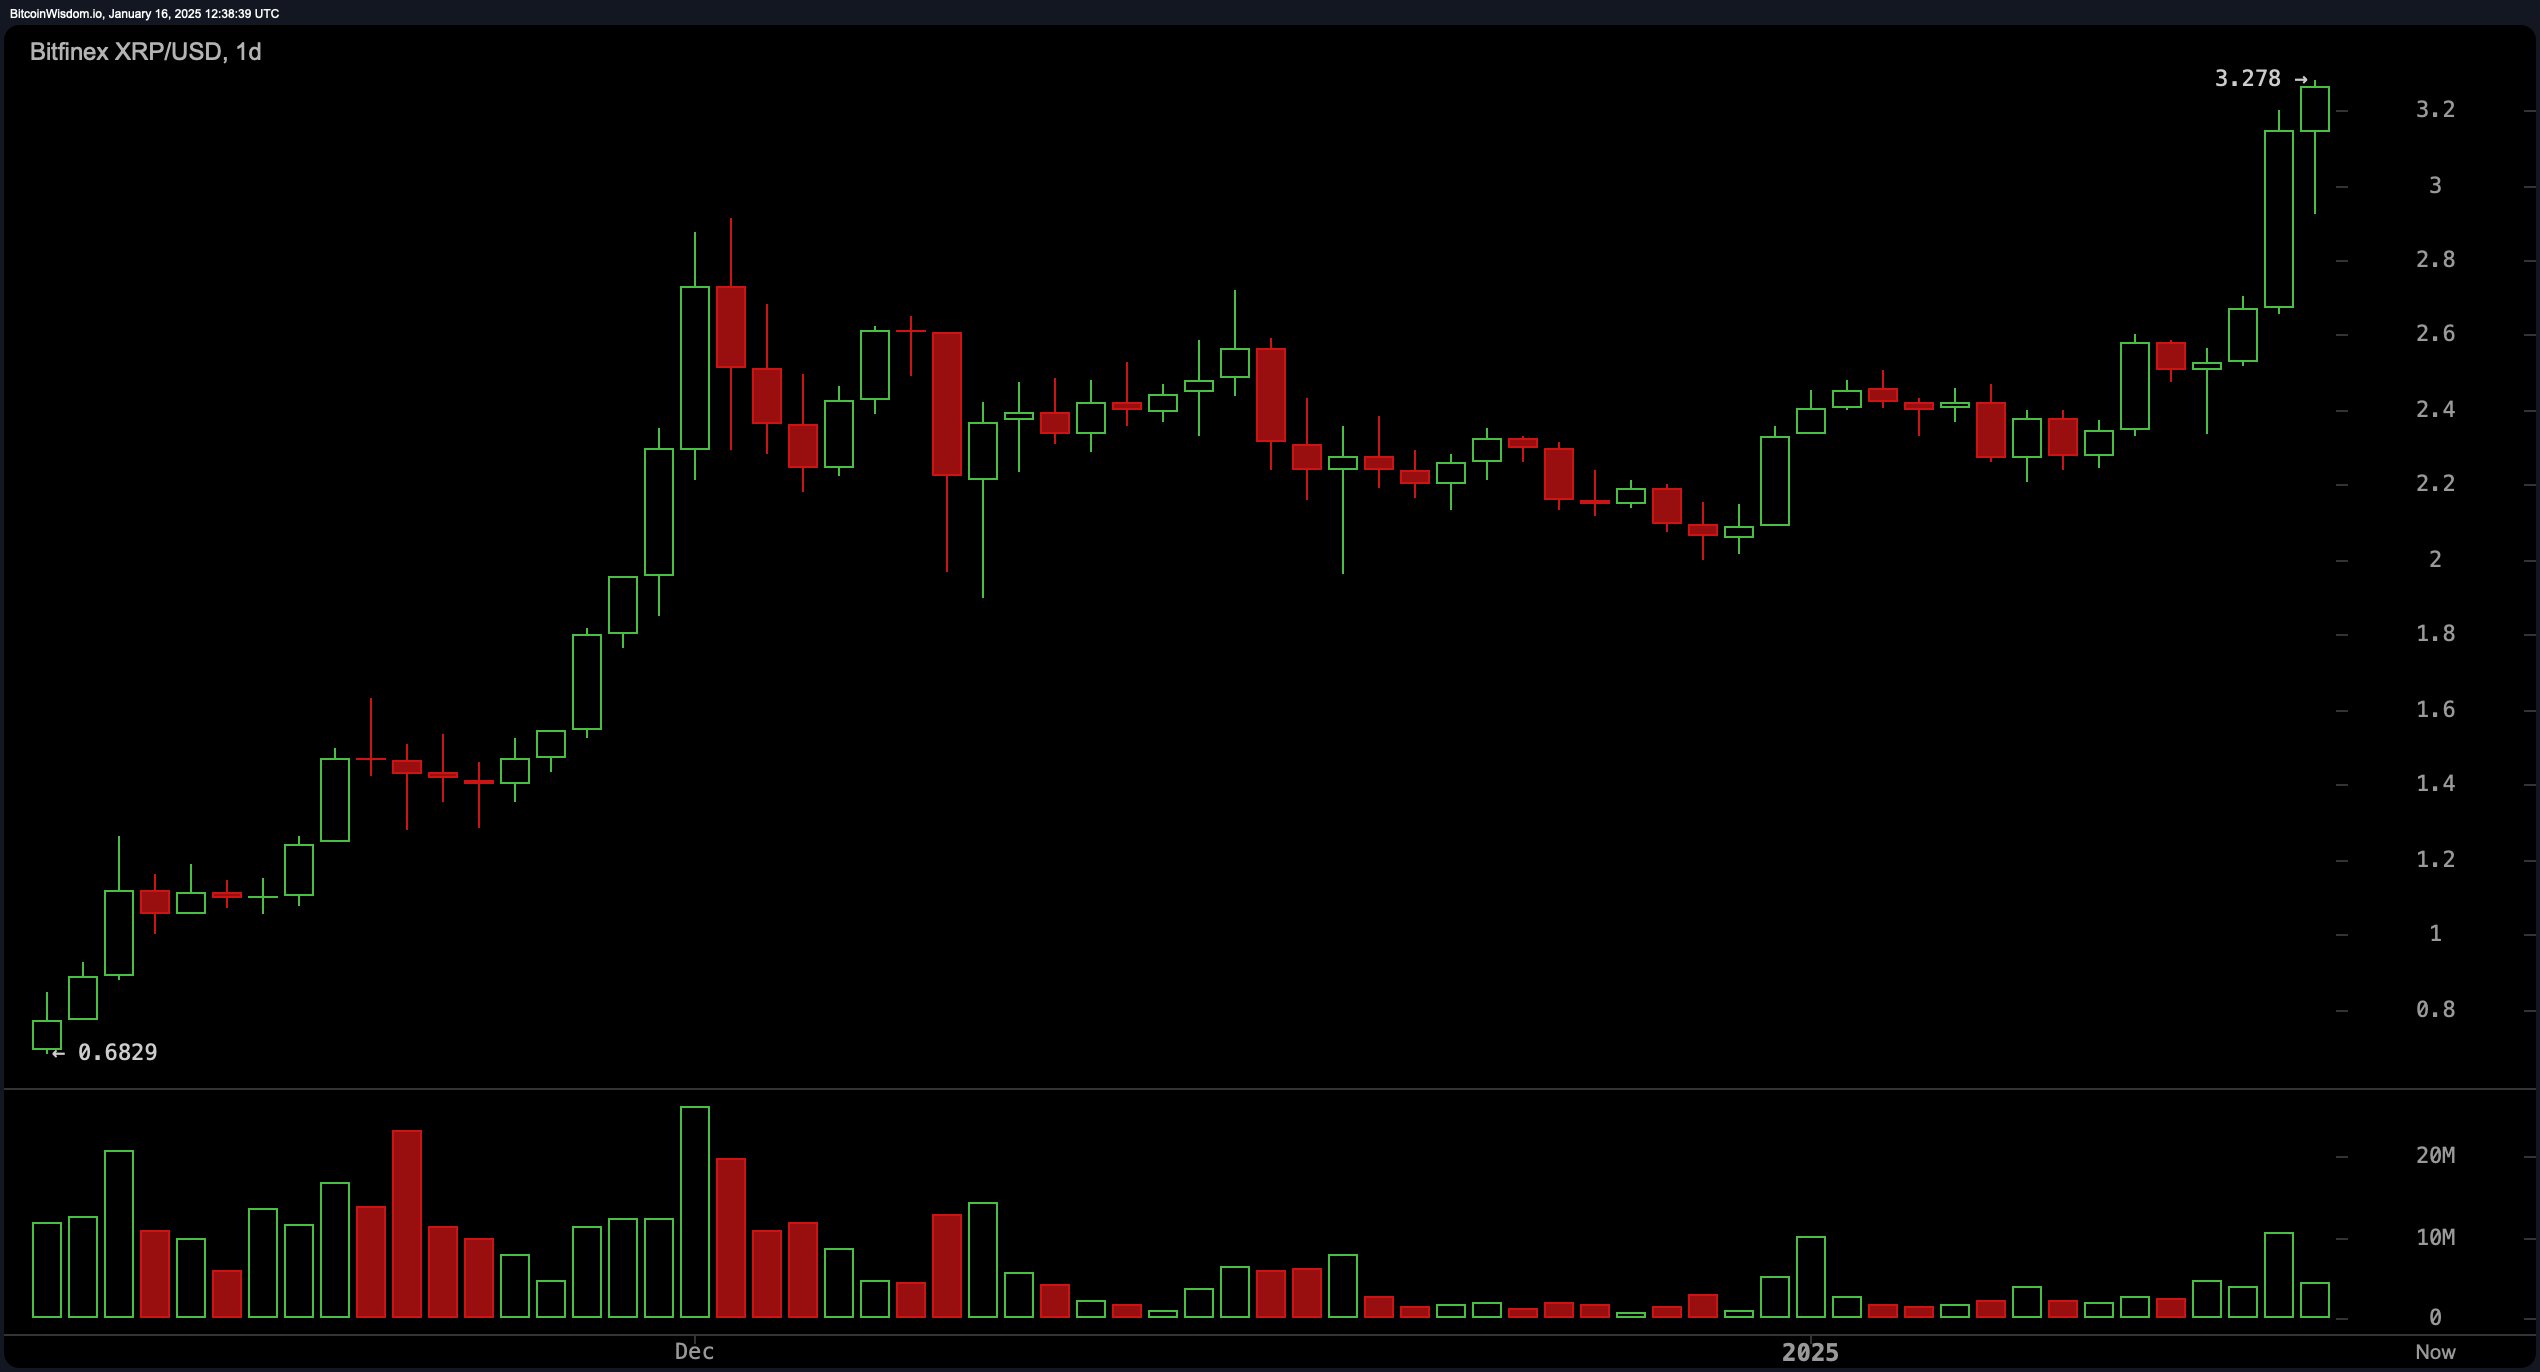
XRP’s daily chart illustrates a definitive upward trajectory, marked by successive higher highs and higher lows. XRP broke through the $3.00 resistance level and is now testing $3.278. Elevated trading volume on breakout days signals heightened buying interest, further reinforcing bullish sentiment. A dip back to $3.00, which now functions as support, might present a strategic entry point, while profit-taking could be considered near the psychological resistance level of $3.50.

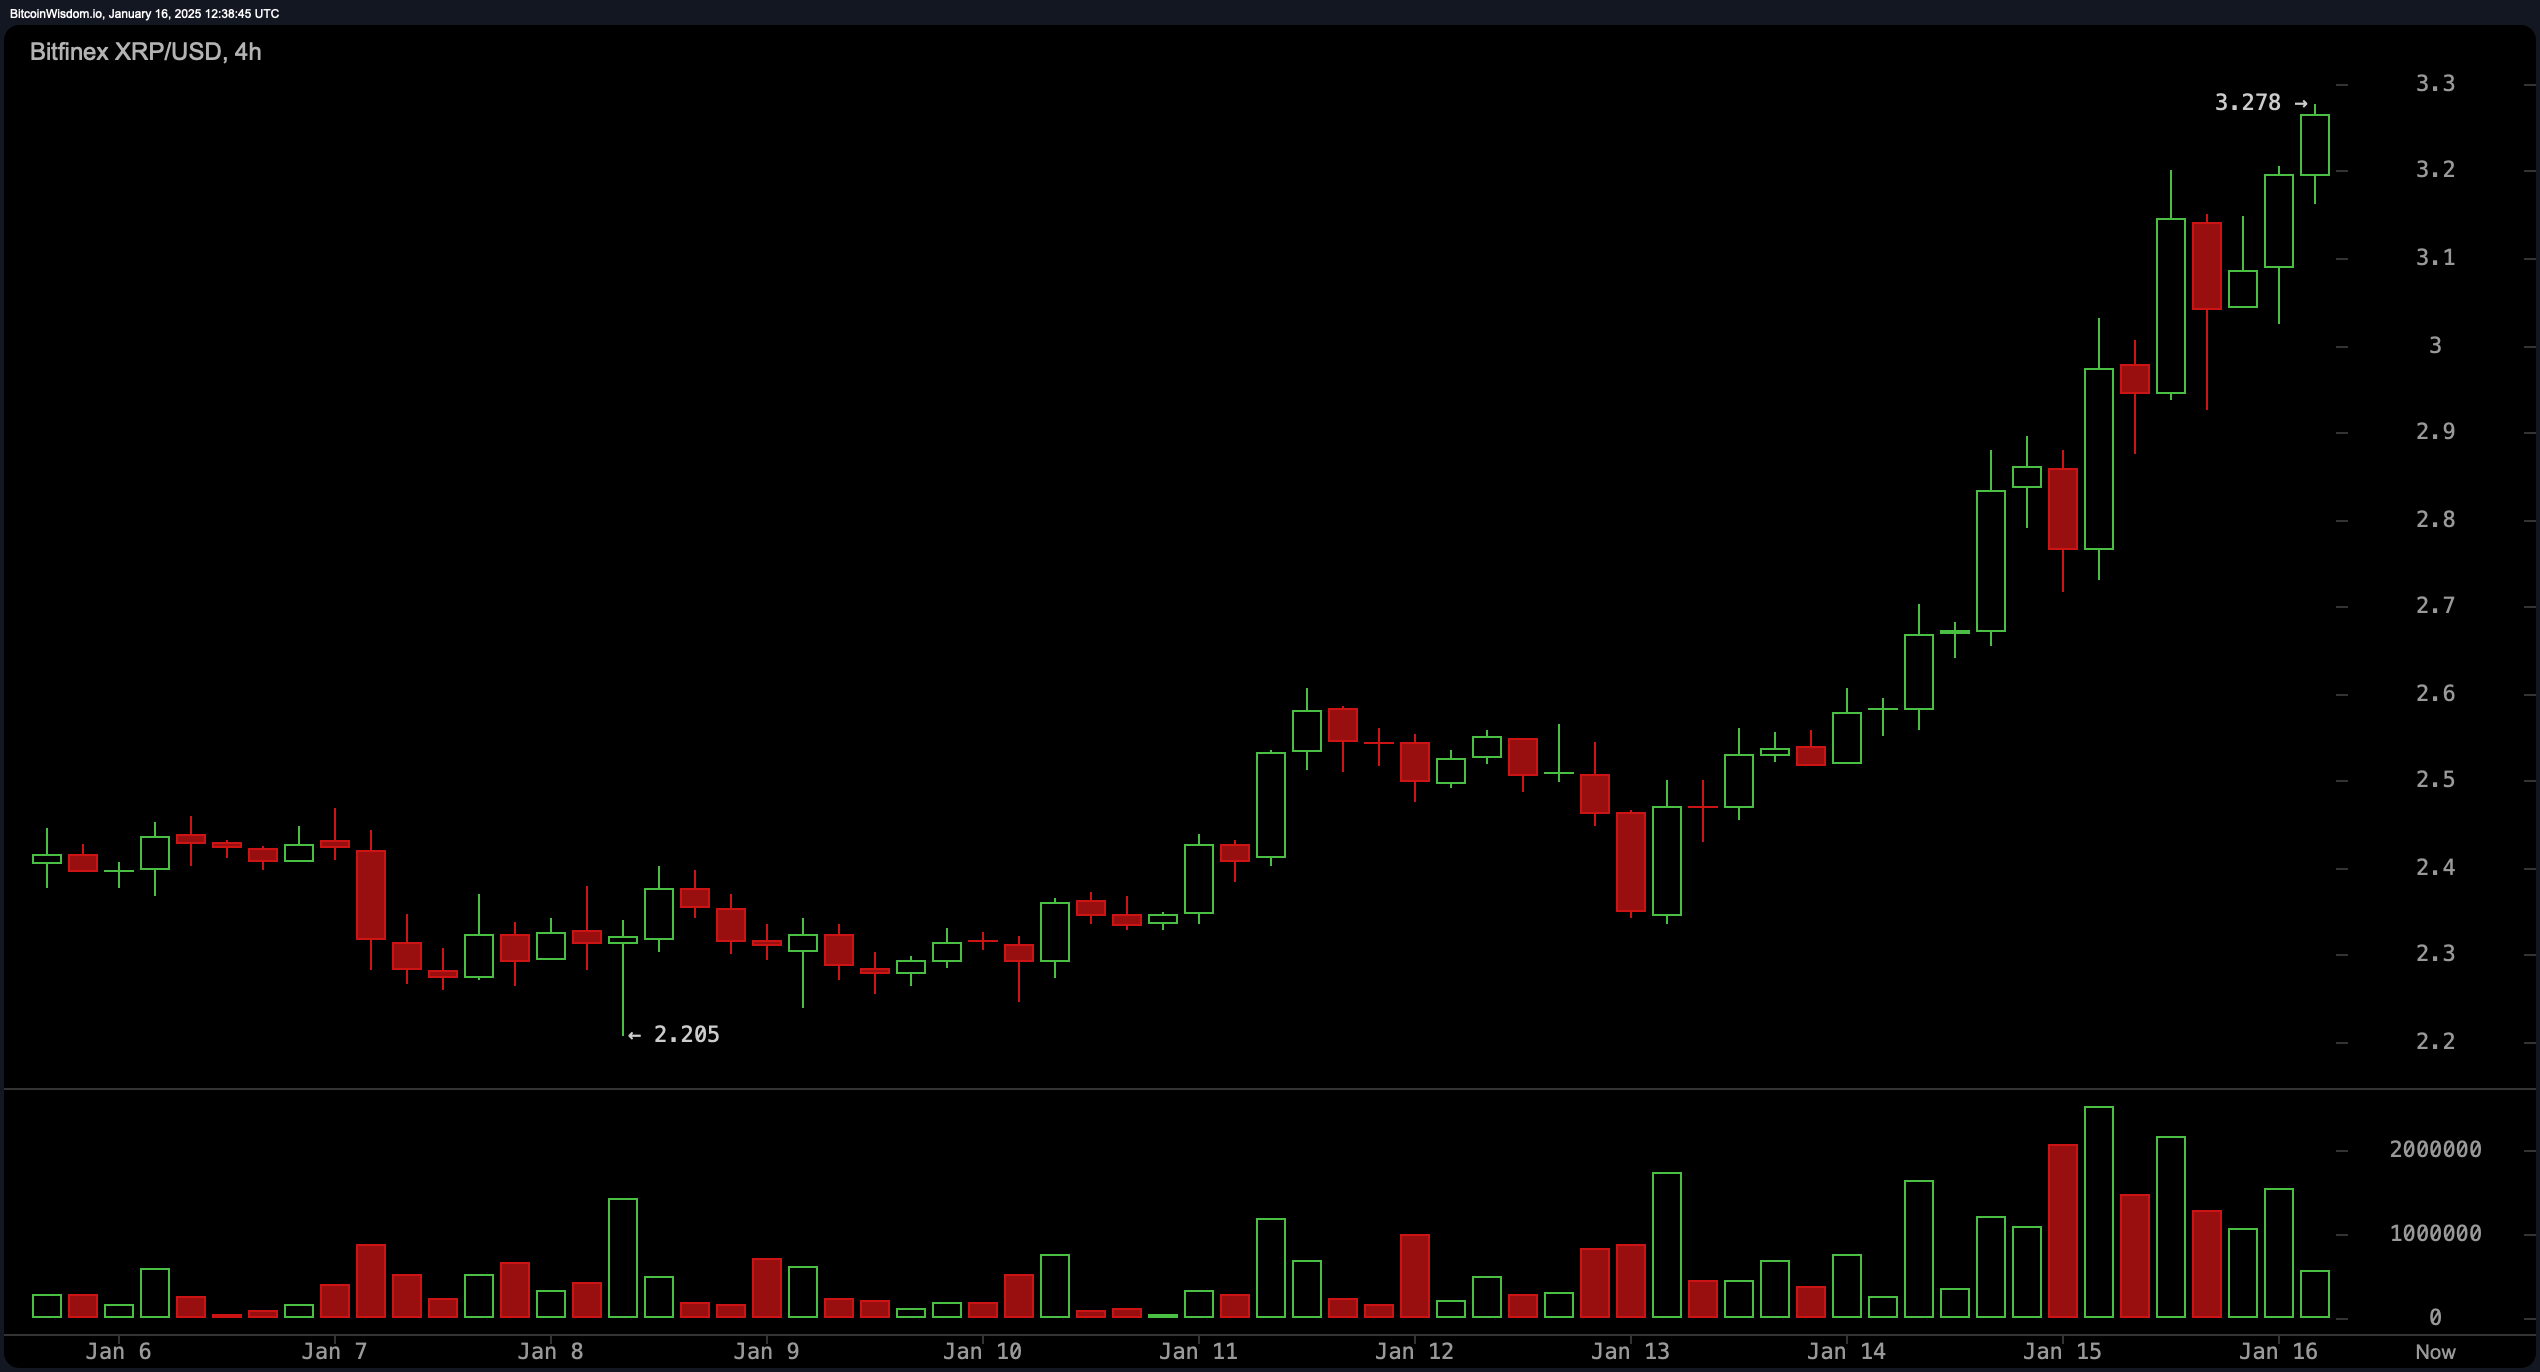
On the four-hour chart, short-term bullish momentum remains intact, with consistent gains following a breakout above $2.50. Retracements toward $3.10 or $3.00 may offer fresh entry opportunities for traders aiming to capitalize on the ongoing uptrend. Resistance around $3.35 to $3.40 in this timeframe suggests a potential zone for profit-taking or cautious exits. Volume trends continue to support upward movement, with distinct surges accompanying price increases.

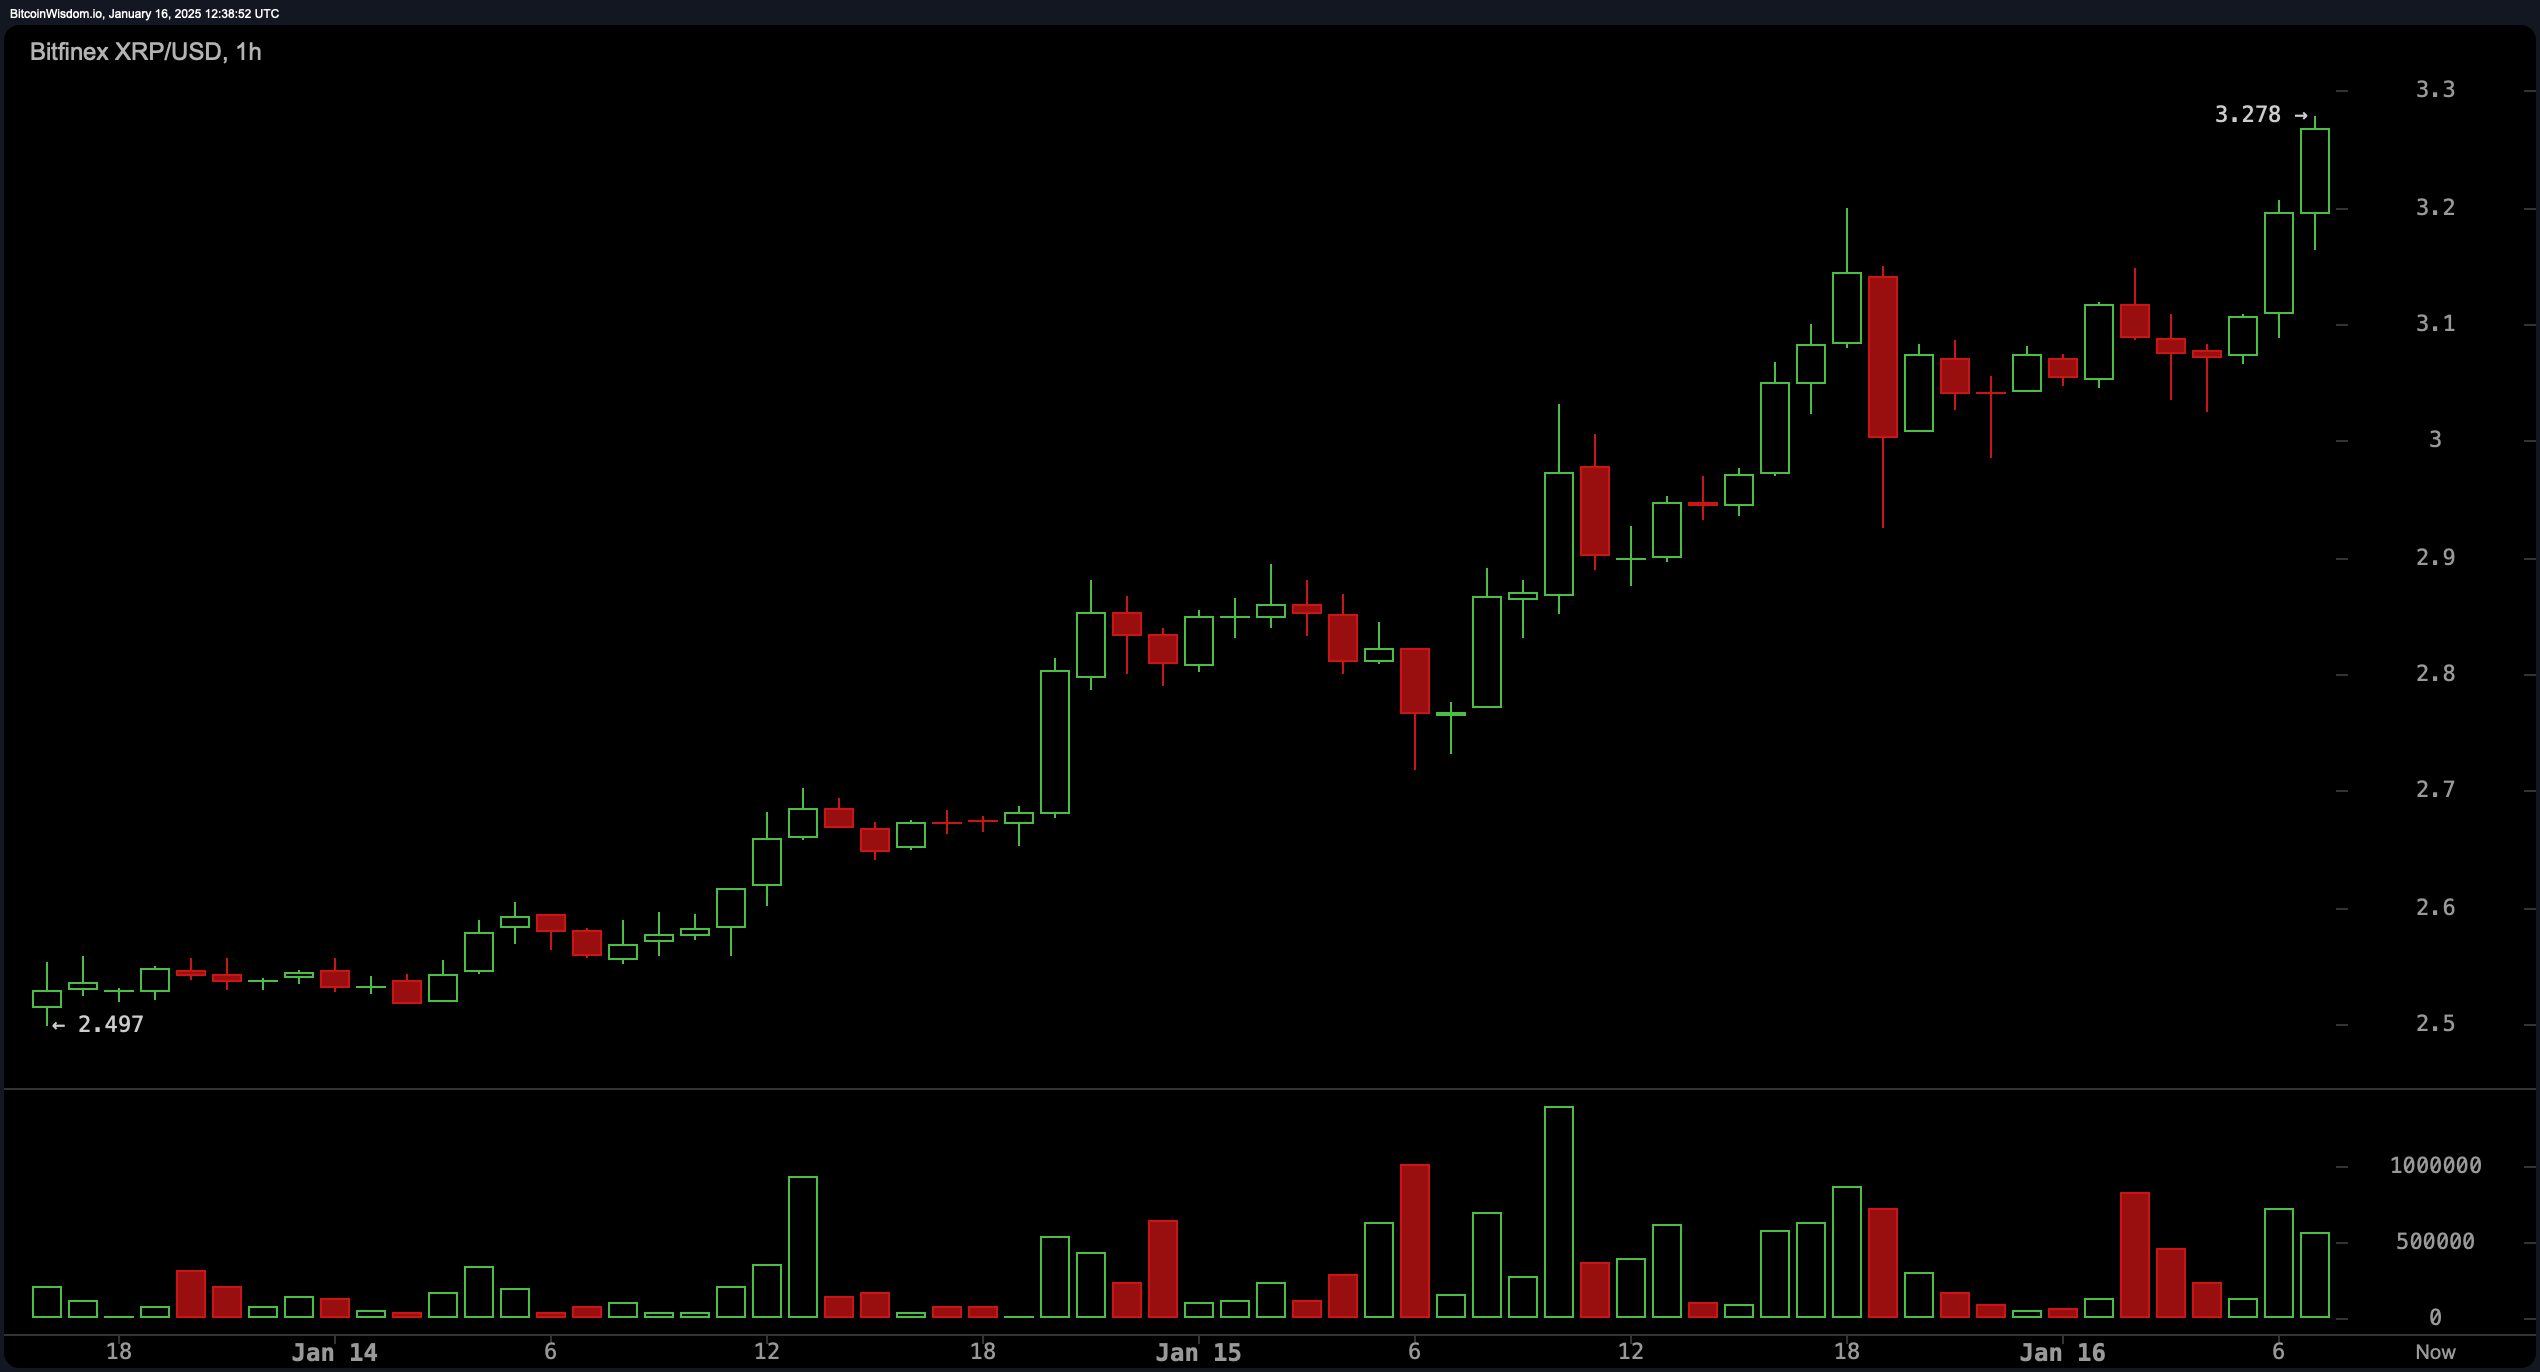
The hourly chart offers a closer view of XRP’s price dynamics, highlighting periods of consolidation and continuation patterns within the broader uptrend. Volume spikes coincide with recent price peaks, reflecting active market participation. Short-term pullbacks to $3.10 or $3.05 could serve as opportunities for scalpers, while exits near $3.30 align with notable resistance levels identified on this chart.

Oscillators present a nuanced picture. The relative strength index (RSI) registers at 76.35, and the Stochastic oscillator reads 96.06, both signaling overbought conditions yet remaining neutral in their immediate implications. Meanwhile, the commodity channel index (CCI) at 268 flashes a sell signal, hinting at potential overhead resistance, while the momentum oscillator at 0.84 suggests sustained bullish action. The moving average convergence divergence (MACD), currently at 0.19, confirms a buy signal in alignment with the prevailing uptrend.
Moving averages (MAs) continue to affirm the bullish outlook. The exponential moving averages (EMAs) for the 10, 20, and 30 periods, as well as the corresponding simple moving averages (SMAs), all indicate favorable buying conditions. Longer-term metrics, such as the 100-period EMA at 1.77 and the 200-period EMA at 1.32, underscore persistent upward momentum. With all major moving averages situated well below the current price, XRP maintains a structurally bullish profile.
Bull Verdict:
XRP’s price action, supported by consistent trading volume, bullish momentum, and favorable technical indicators, paints a strong case for continued upward movement. The ability to hold above key support levels like $3.00, combined with the current uptrend across multiple timeframes, suggests the potential for further gains toward the psychological resistance at $3.50 and beyond. As long as trading volume remains high and key moving averages stay below the price, XRP appears structurally poised for sustained bullish performance.
Bear Verdict:
While XRP exhibits significant upward momentum, overbought signals from oscillators such as the RSI and Stochastic oscillator introduce caution. A failure to hold above $3.00 could trigger a broader correction, potentially leading to retests of lower support levels like $2.74. Additionally, profit-taking near resistance levels at $3.35 or $3.50 could limit upside potential in the short term. Without sustained buying interest, the current rally risks losing steam, opening the door for bearish reversals.
 news.bitcoin.com
