Stellar’s XLM price surged 14% to $0.4795, with a market cap of $14.58 billion and a 24-hour trading volume of $1.8 billion, trading within an intraday range of $0.4191 to $0.4896. XLM’s rise has coincided with the spike XRP has witnessed this week.
Stellar
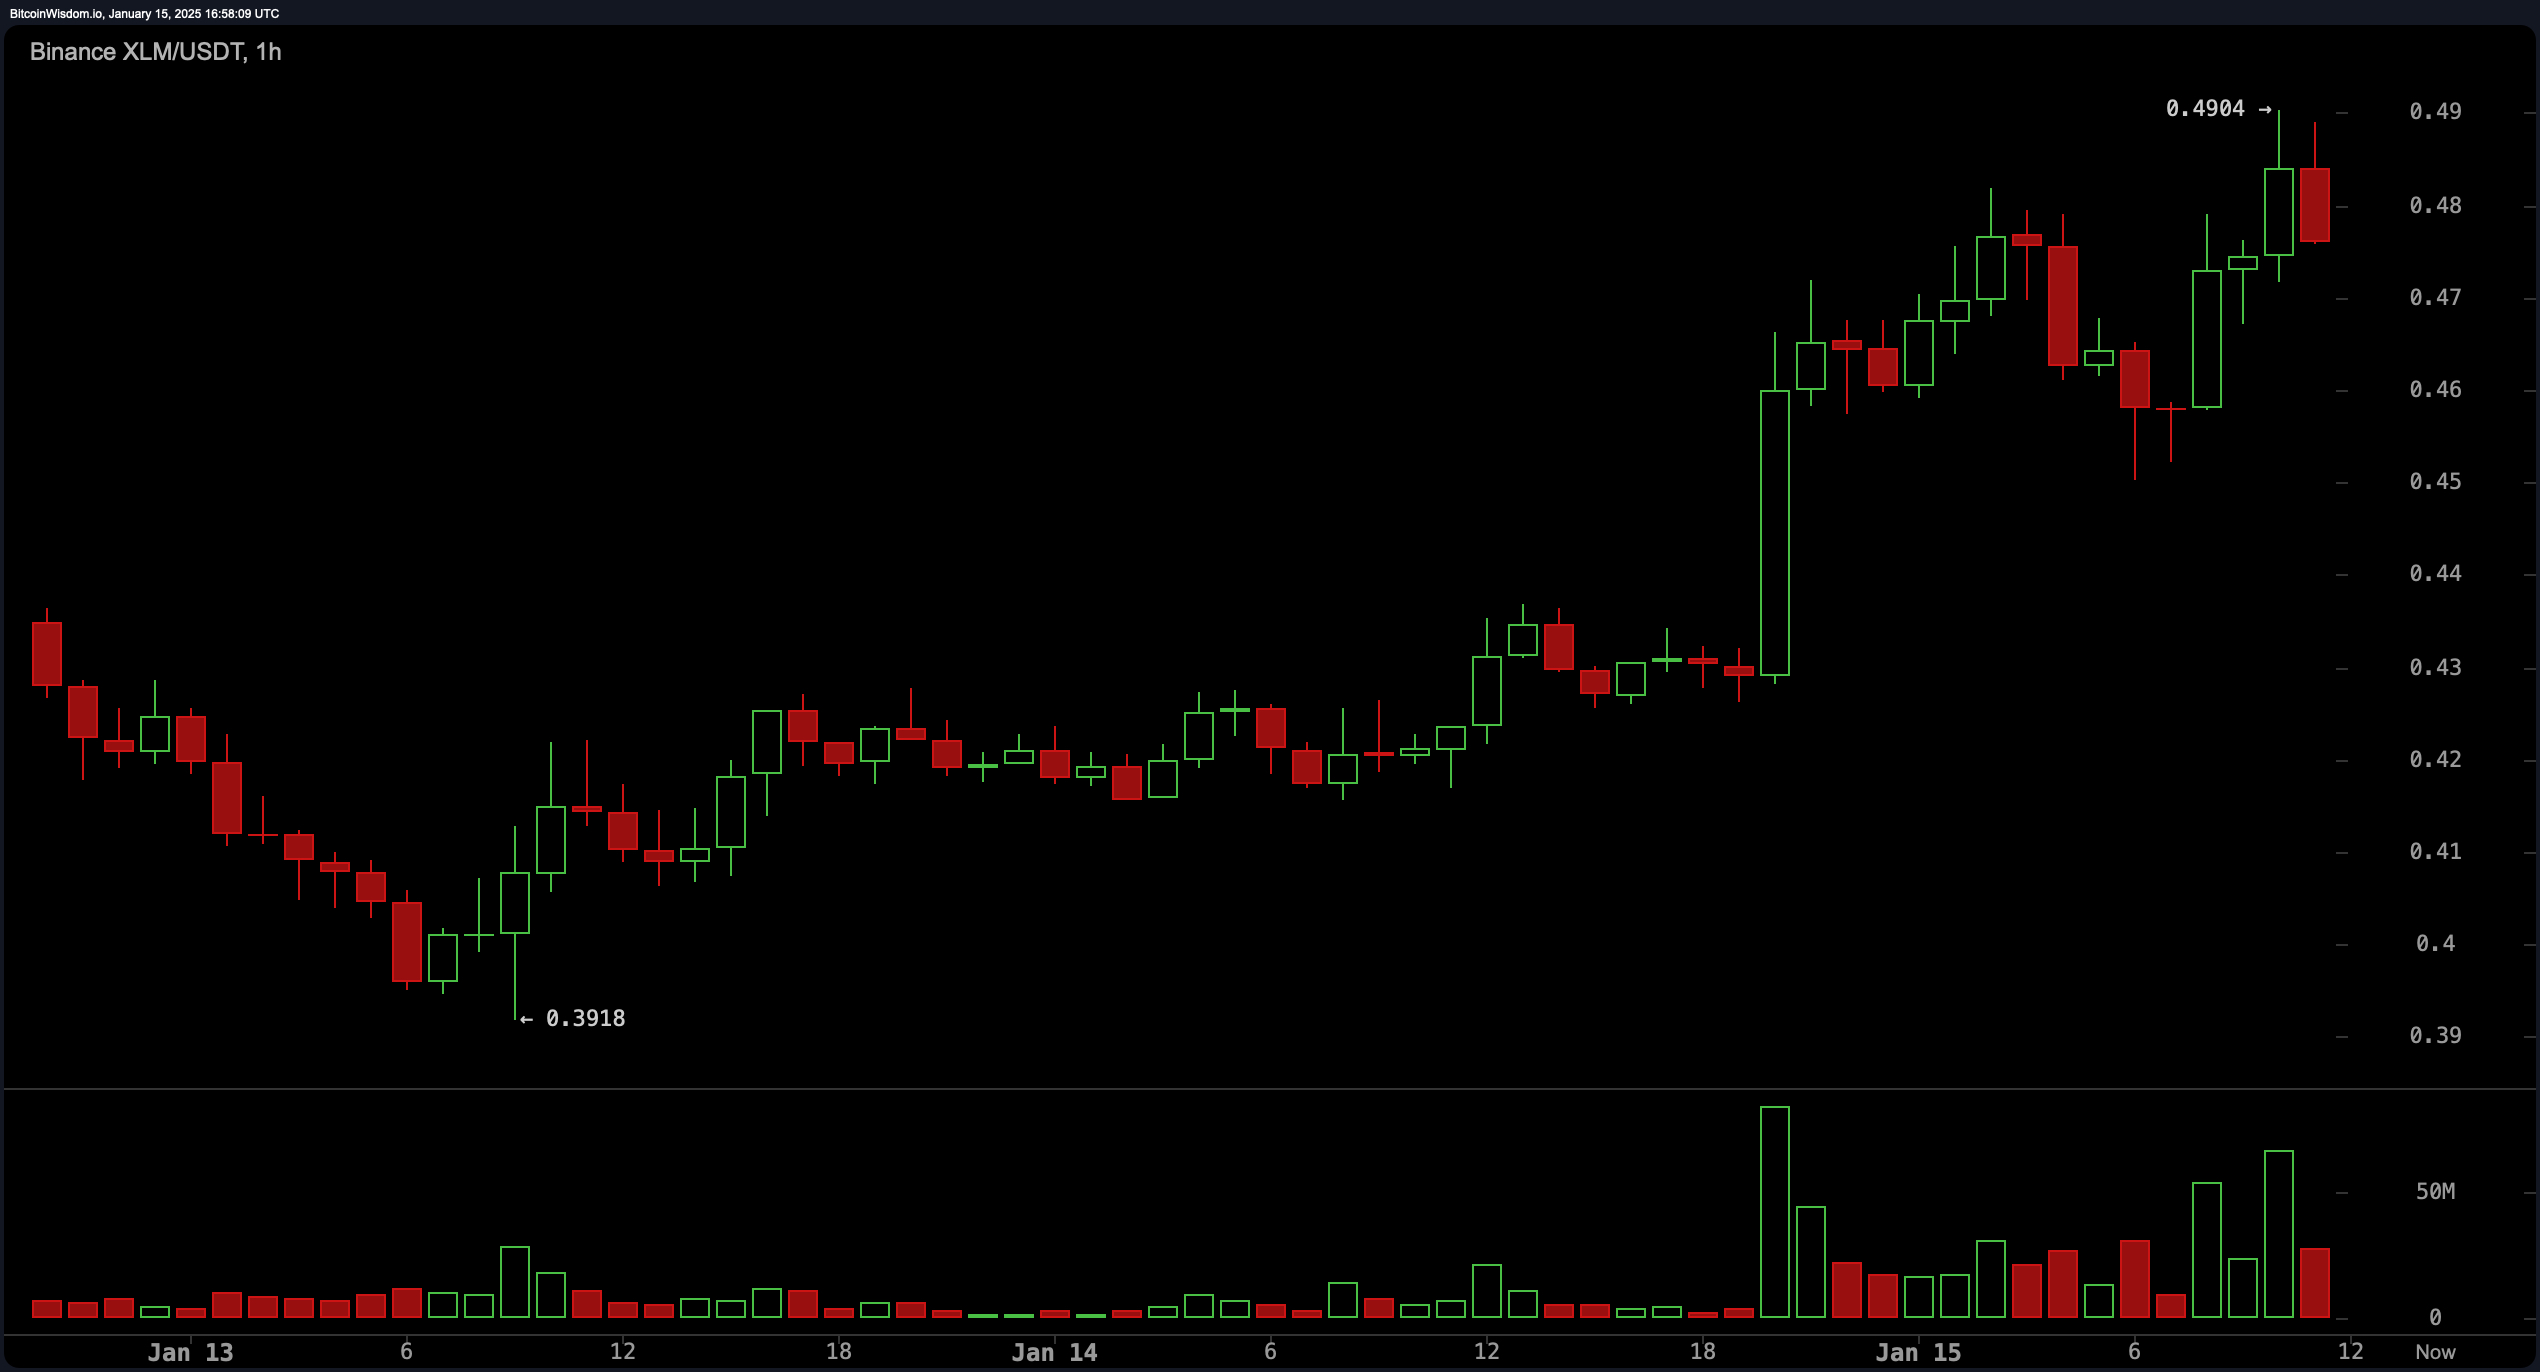
Stellar’s hourly chart reveals a bullish trend, characterized by higher highs and lows after a dip to $0.3918, supported by volume spikes near key breakout levels at $0.43 and $0.47. Moving averages, including the exponential moving average (EMA) for 10, 20, and 30 periods, signal continued upward momentum with buy actions at $0.4316, $0.4202, and $0.4120, respectively. Oscillators like the momentum indicator (10) and the moving average convergence divergence (MACD) also confirm bullish sentiment.

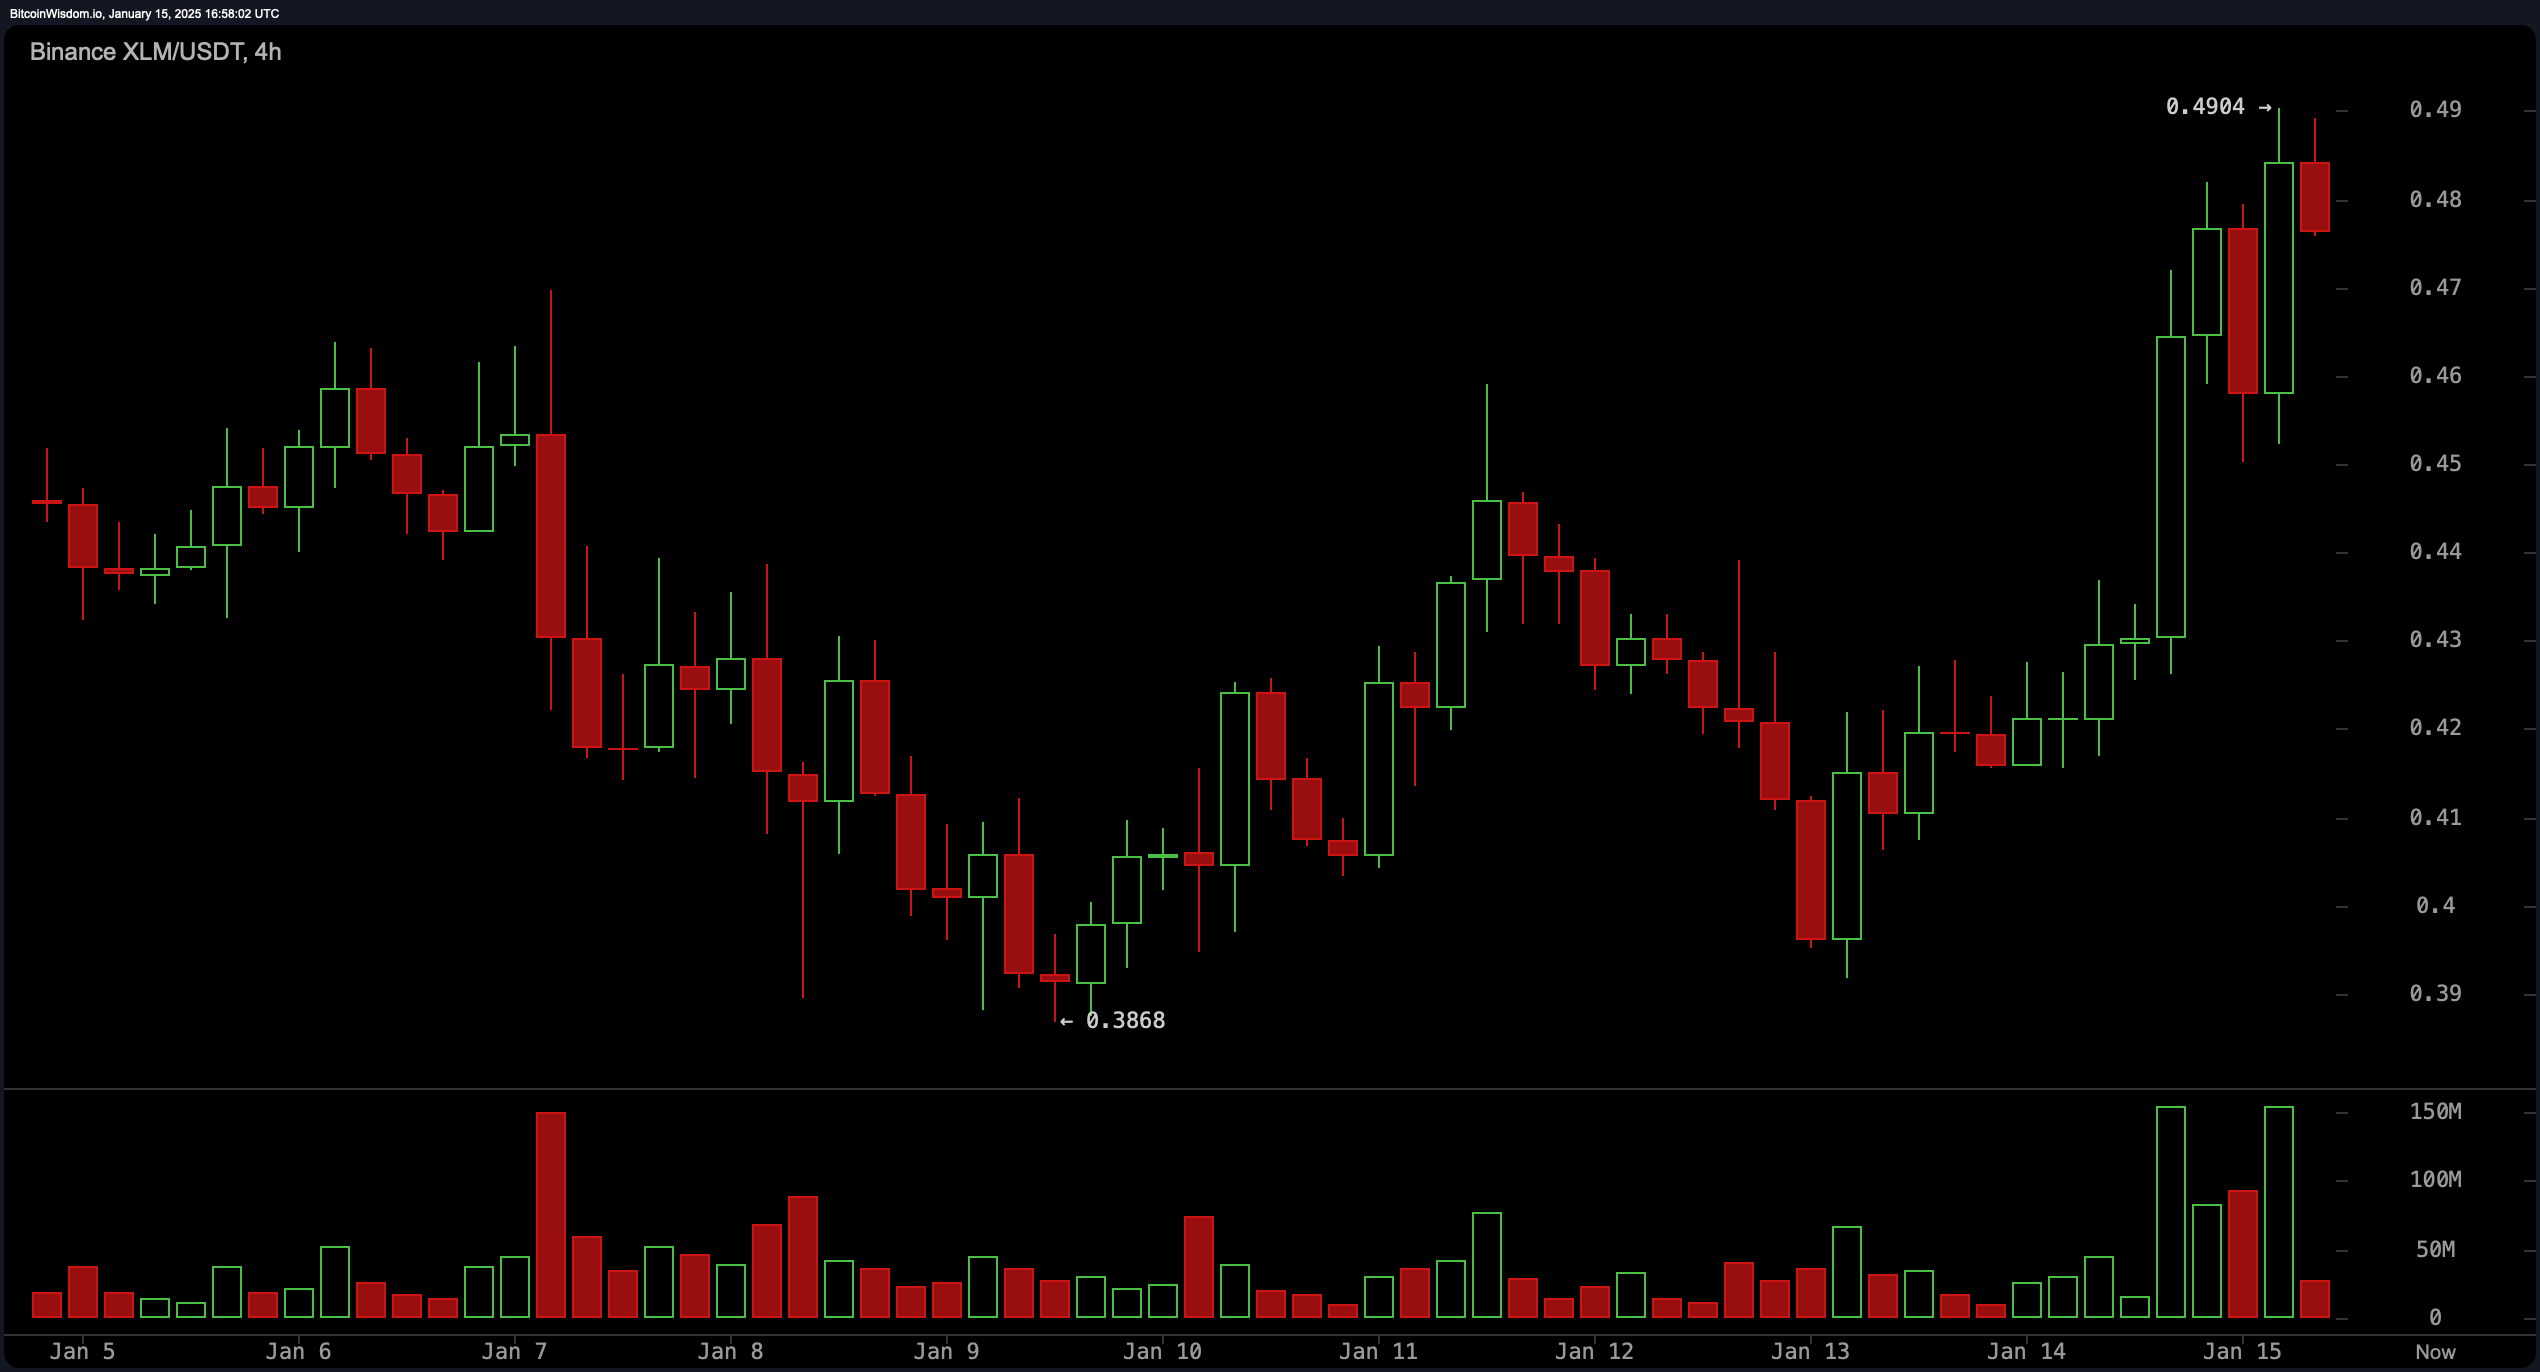
On XLM’s four-hour chart, the formation of a double bottom near $0.3868 has catalyzed a steady recovery to $0.4904, further reinforcing bullish indicators. Traders eyeing short-term gains may look for entries near $0.47 to $0.48, with an exit strategy targeting resistance at $0.50, though caution is advised due to potential pullbacks at this psychological level.

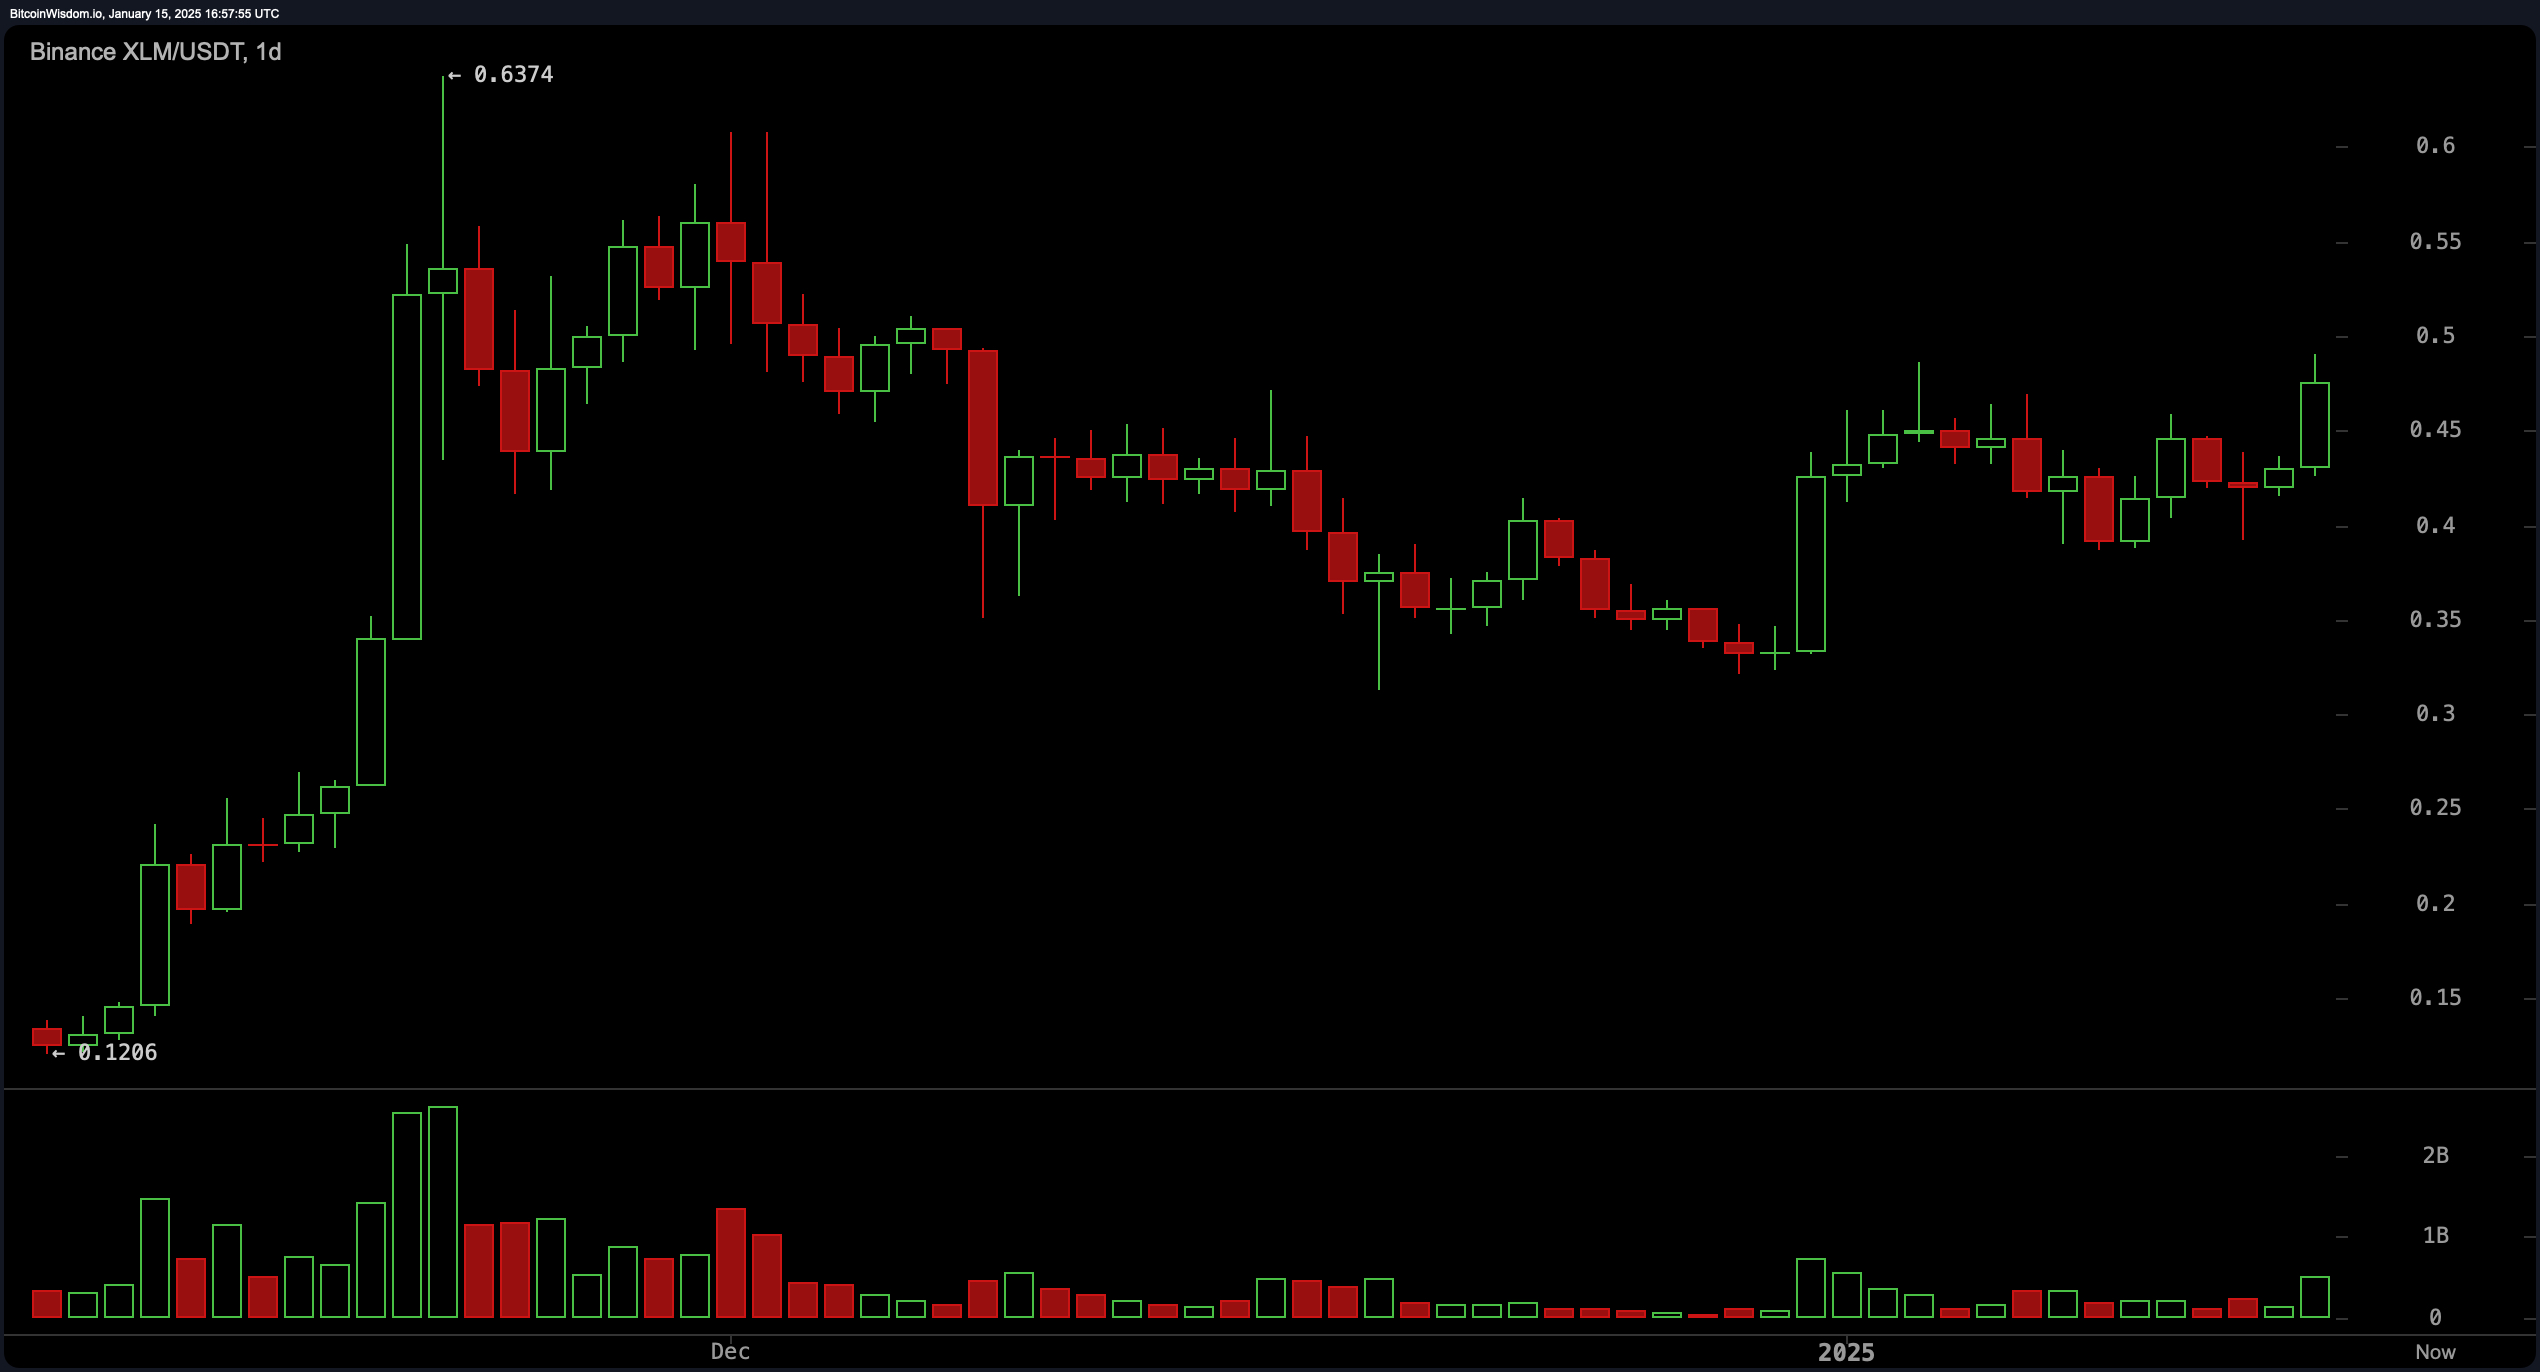
Stellar’s daily chart highlights longer-term bullishness, with recent consolidation transitioning to recovery and support from moderate volume increases. Key resistance lies between $0.55 and $0.60, making it a critical zone for traders to monitor. All moving averages, including the EMA and simple moving average (SMA) across multiple periods, maintain a buy signal, further cementing positive outlooks for stellar’s price trajectory.

Moving averages for stellar (XLM) reflect a strong bullish trend, with all key averages signaling positivity. The exponential moving averages (EMAs) for 10, 20, and 30 periods are at $0.4316, $0.4202, and $0.4120, respectively, while the simple moving averages (SMAs) for the same periods confirm upward momentum. These consistent buy signals indicate robust support for further price gains.
Bull Verdict:
Stellar (XLM) is positioned for continued upward momentum, driven by bullish signals across all major charts, supported by strong moving averages and key oscillators like the momentum indicator and MACD. With higher highs and a solid recovery from recent lows, a breakout above $0.50 could catalyze further gains toward the $0.55 to $0.60 resistance zone.
Bear Verdict:
While XLM shows bullish tendencies, resistance at $0.50 and $0.55 presents potential barriers that could trigger pullbacks. Oscillators like the relative strength index (RSI) and Stochastic hovering in neutral territory suggest caution, and waning volume could dampen price momentum. A drop below $0.46 might confirm bearish sentiment in the short term.
 news.bitcoin.com