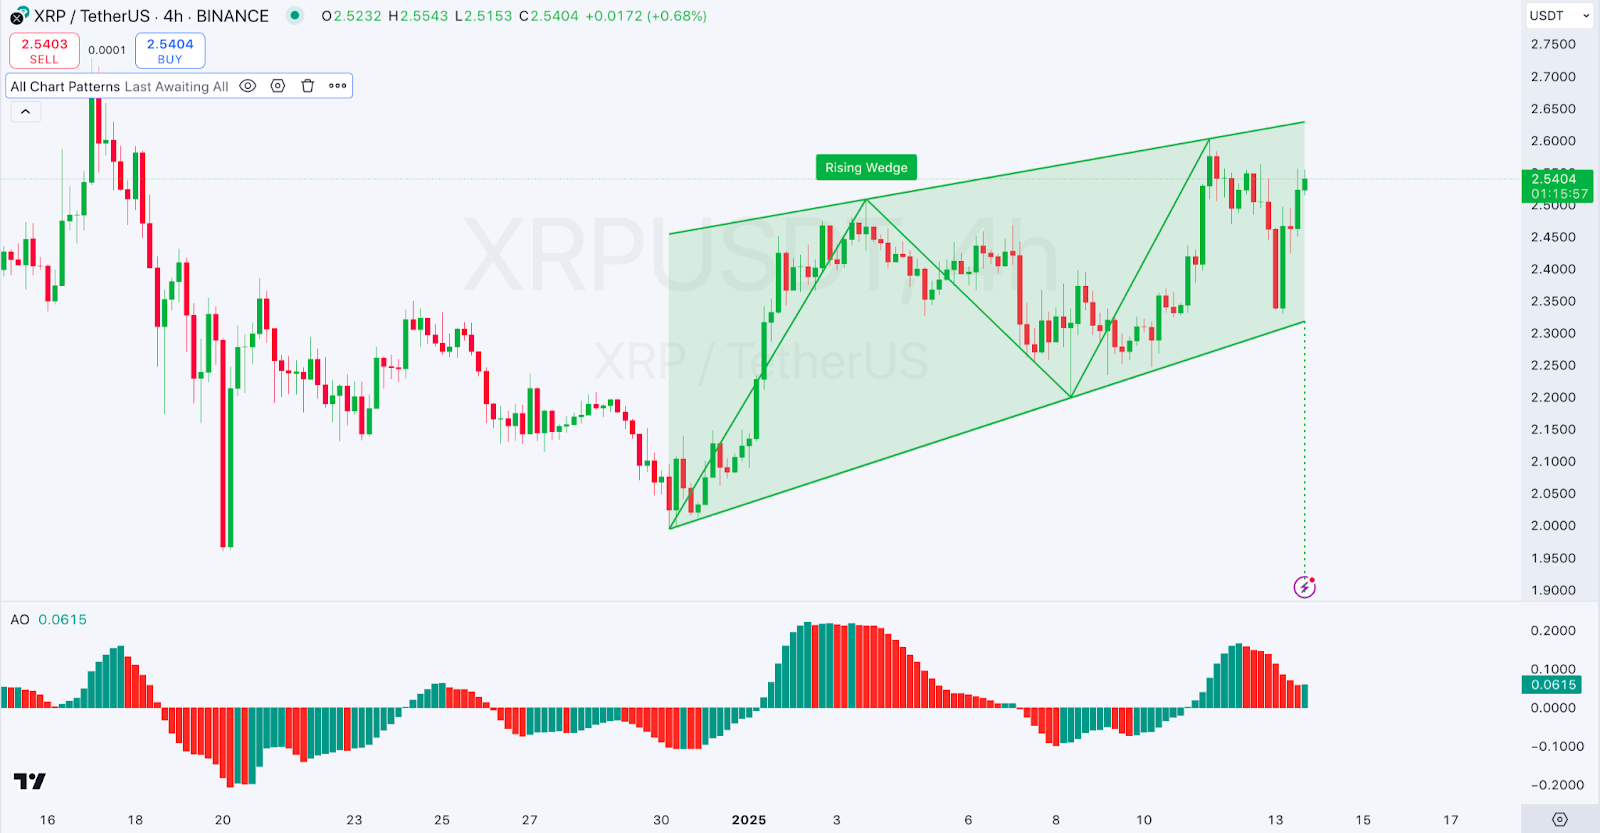
The crypto market is struggling with Binance Coin (BNB) in the red zone. At press time, BNB price was trading at $666.30. It was a 4.24% drop in the past 24 hours and an 8.45% decrease in one week.
BNB has a total market cap of $97.26 billion with a circulating supply of 150 million tokens. Current 24-hour trading volume is of $1.15 billion.
Rising Wedge Formation Indicates Bearish Outlook
According to The Crypto Titan’s analysis, BNB’s weekly chart shows a rising wedge pattern, a technical structure that often signals a potential bearish reversal. The pattern is marked by higher highs and higher lows within converging trendlines, indicating weakening bullish momentum as the price narrows into a tighter range.
BNB has currently broken out of the wedge at $666.30, putting it in a critical zone as it is now near the wedge’s lower boundary. If a breakdown below this level is confirmed the bear trend becomes stronger, and the next potential support level appears to be around $563.

On the plus side, key resistance points come in at $740 on the upper wedge line of the trend and the $800 psychological point.
BNB Price Bearish Momentum and Breakdown Scenarios
Additionally, indicating a potential loss of bullish momentum, BNB price is forming a narrowing wedge pattern. The analysts, however, point to a possible sell position, right at the wedge’s lower boundary between $665 and $670. A breakdown below this zone would mean that the price could dip faster, likely to hit a target of $563.
Such a breakdown could drop BNB price adding pressure on the price. Analysts suggest the price may retest the lower boundary as resistance before continuing downward.
Futures Market Reflects Mixed Sentiment
Data from Glassnode shows a decline in BNB Futures open interest, which has tapered off after hitting peak levels. This reduction is accompanied by a drop in the total value locked in Futures contracts, suggesting reduced activity in the derivatives market.
Long liquidations were most important during December, hitting a peak of $9.79 million. But recent weeks have seen a more level liquidation balance between longs and shorts, representing shifting to a neutral market position.
A combined legacy of reduction in leverage, healthy preservation of the market, and normalization of long and short liquidations, and steady trading volume.

Outlook and Market Position
The rise wedge pattern is still indicating possible bearish tendencies in the technical setup of BNB. Mixed sentiment reigns as leverage reduces in the derivatives market trends, which contributes to uncertainty.
A breakdown below $665 to $670 will be watched keenly by traders. It could be the start of a deeper decline. However, this would reverse the bearish bias, provided the resistance was reclaimed at $740 and above.
 thecoinrepublic.com
