XRP is trading at $2.576, up 4.9% in the last 24 hours, with a market cap of $148 billion, a 24-hour trading volume of $6.92 billion, and an intraday price range of $2.43 to $2.603.
XRP
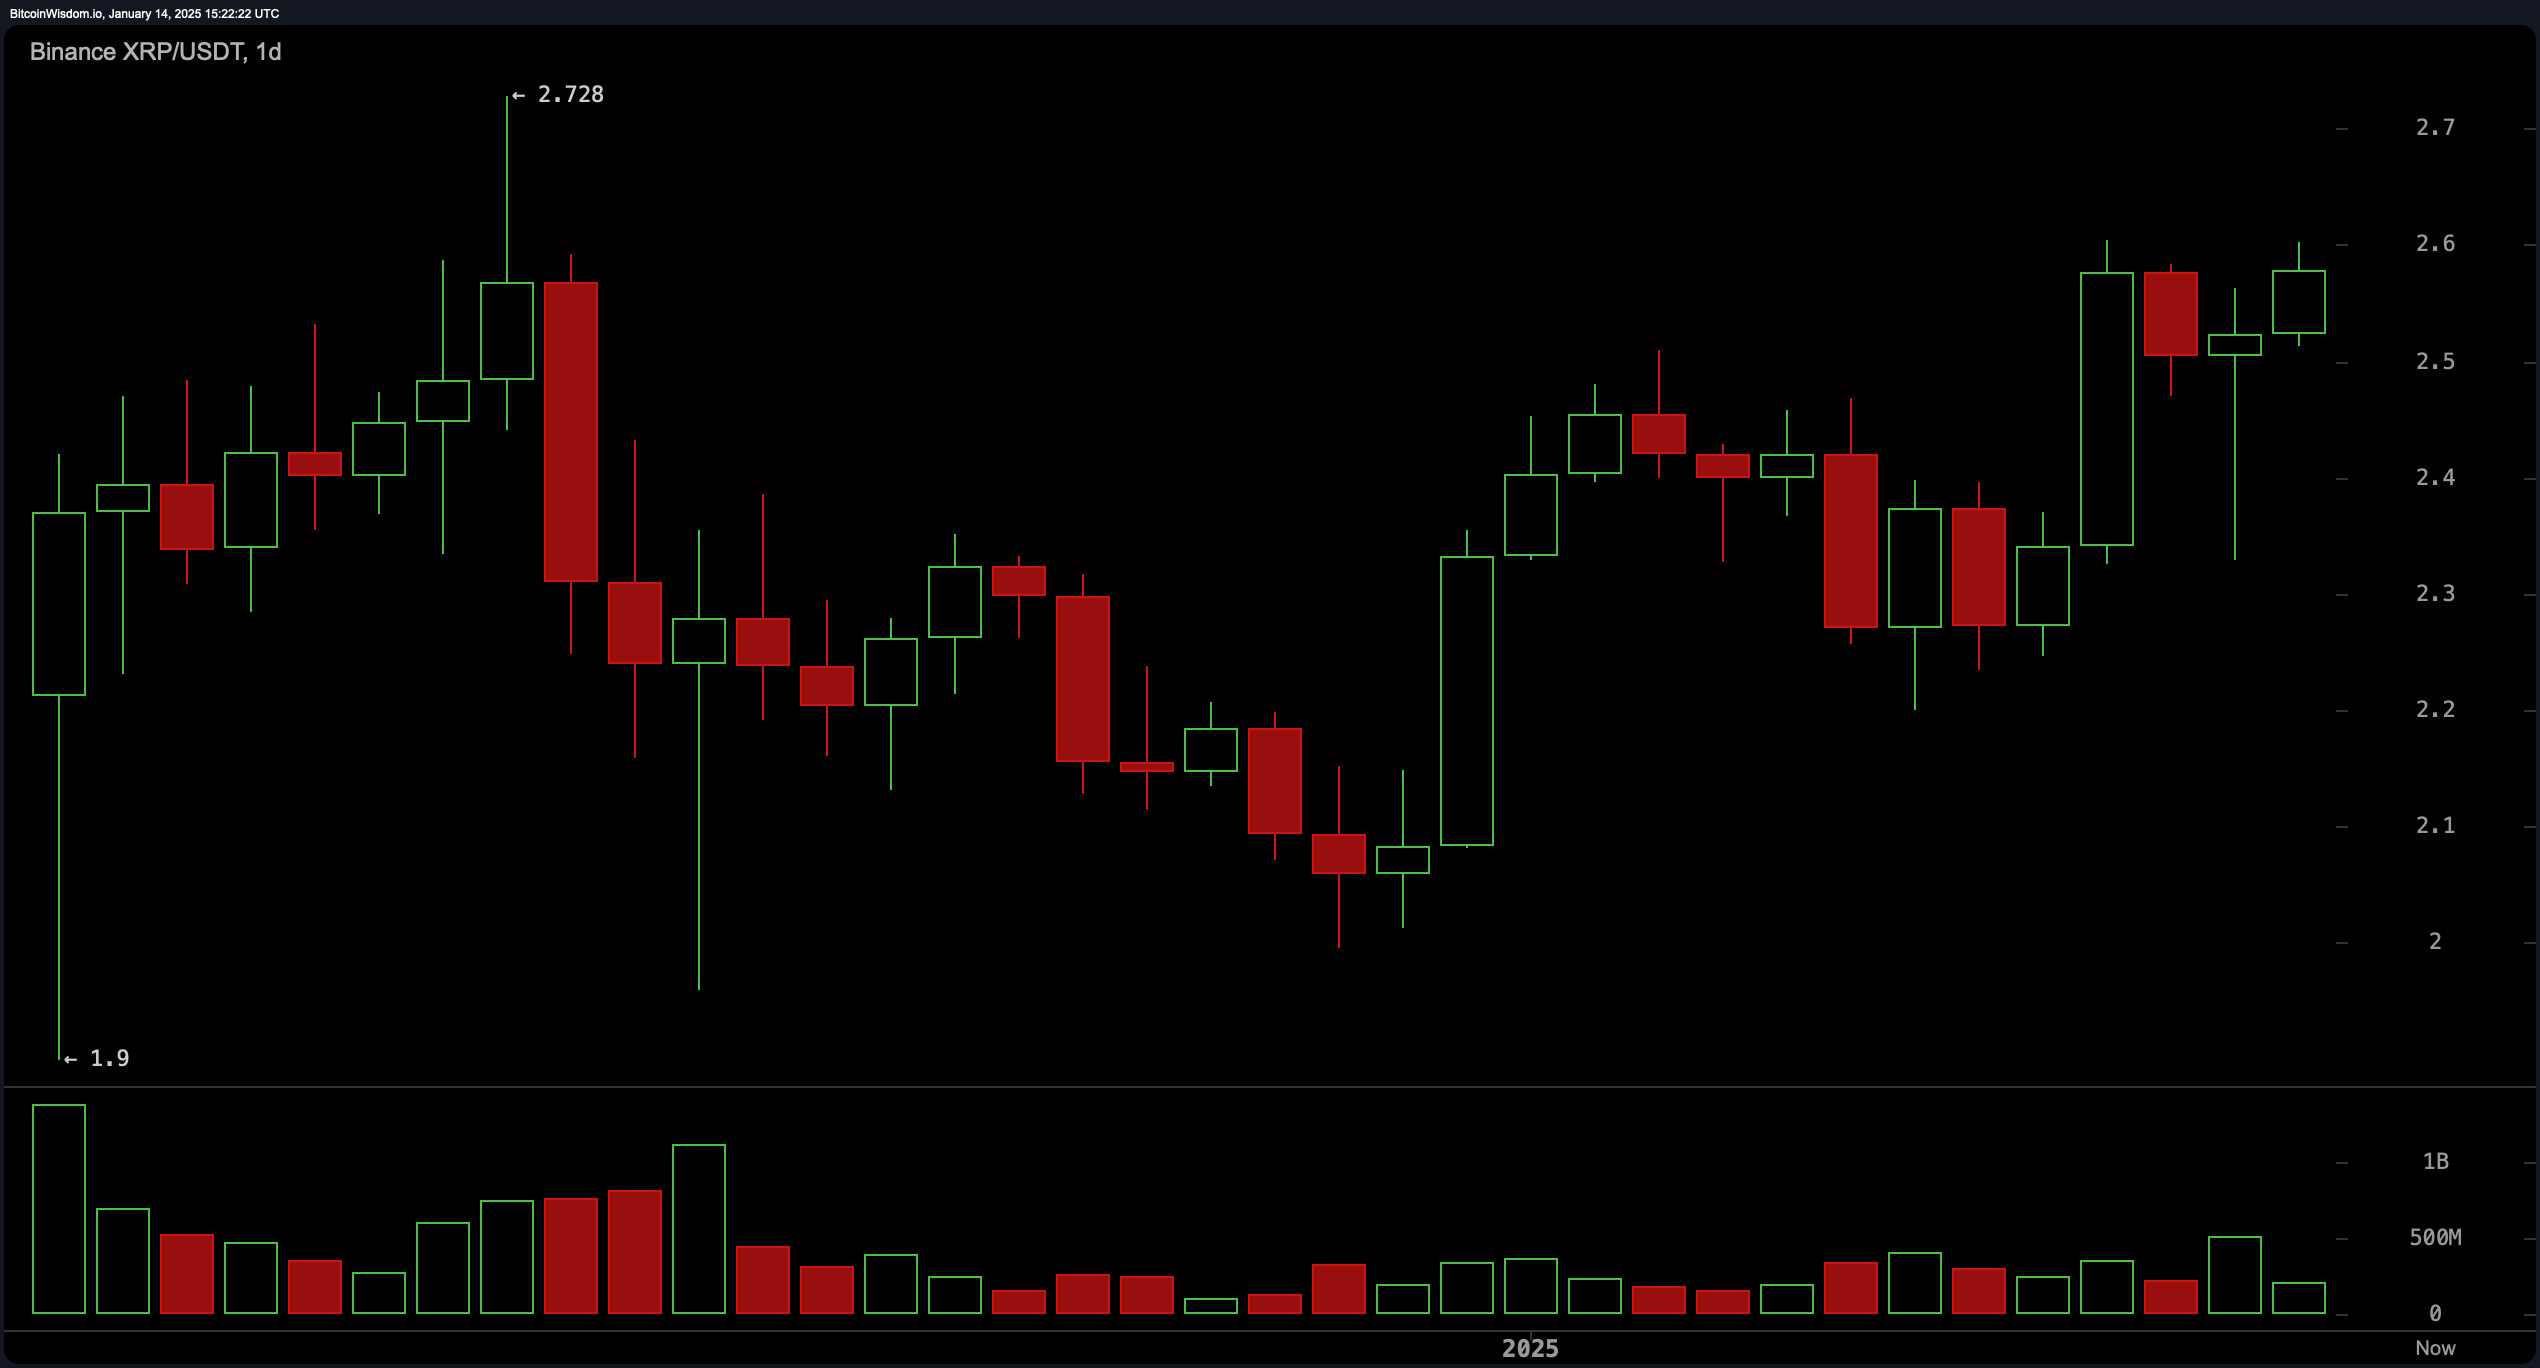
The daily chart reveals that XRP has been forming higher lows and higher highs, signaling a potential continuation of its upward trajectory. Despite a previous sharp bearish move, the recent recovery has gained momentum with increased buying interest on bullish days. Key resistance is identified at $2.70, while support is firm around $2.40, with a breakout above resistance likely to trigger further gains. Conversely, a drop below support would indicate a potential reversal in trend.

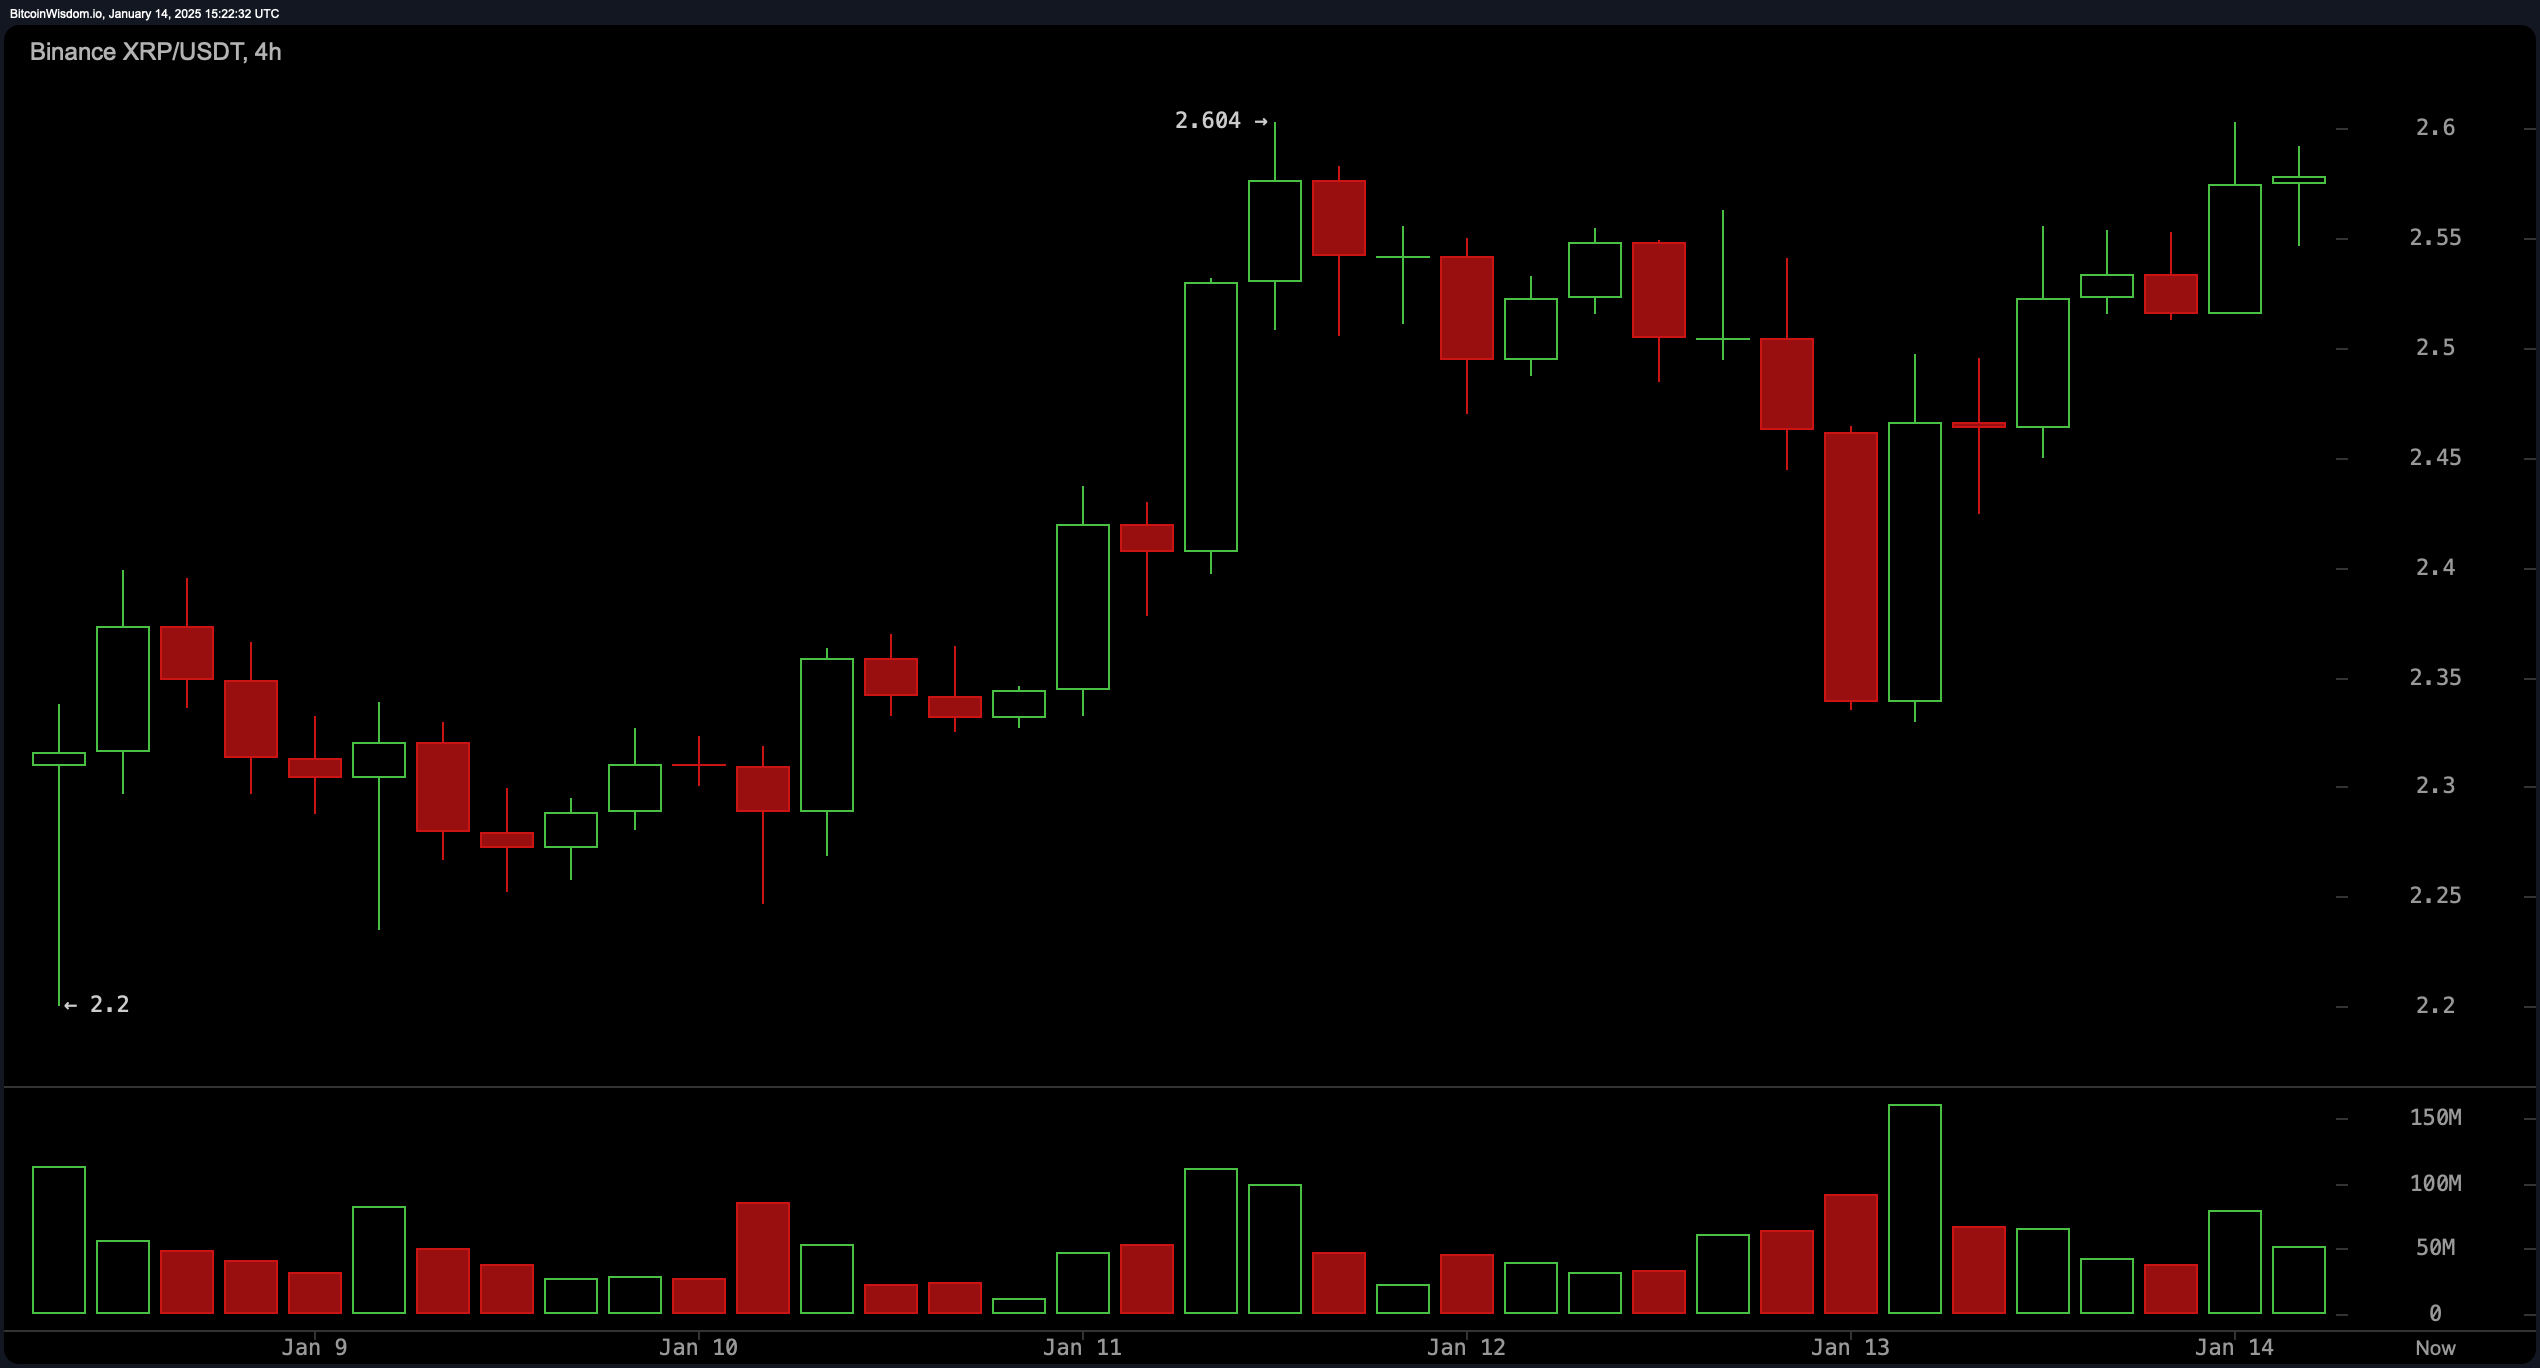
On the four-hour chart, XRP appears to be consolidating around $2.60 following a strong rally. Volume spikes during upward moves highlight continued bullish interest, though the current consolidation phase has seen a slight reduction in activity. Resistance is noted at $2.604, while support lies at $2.45. A breakout above resistance could present a buying opportunity, whereas a decline below support may warrant caution.

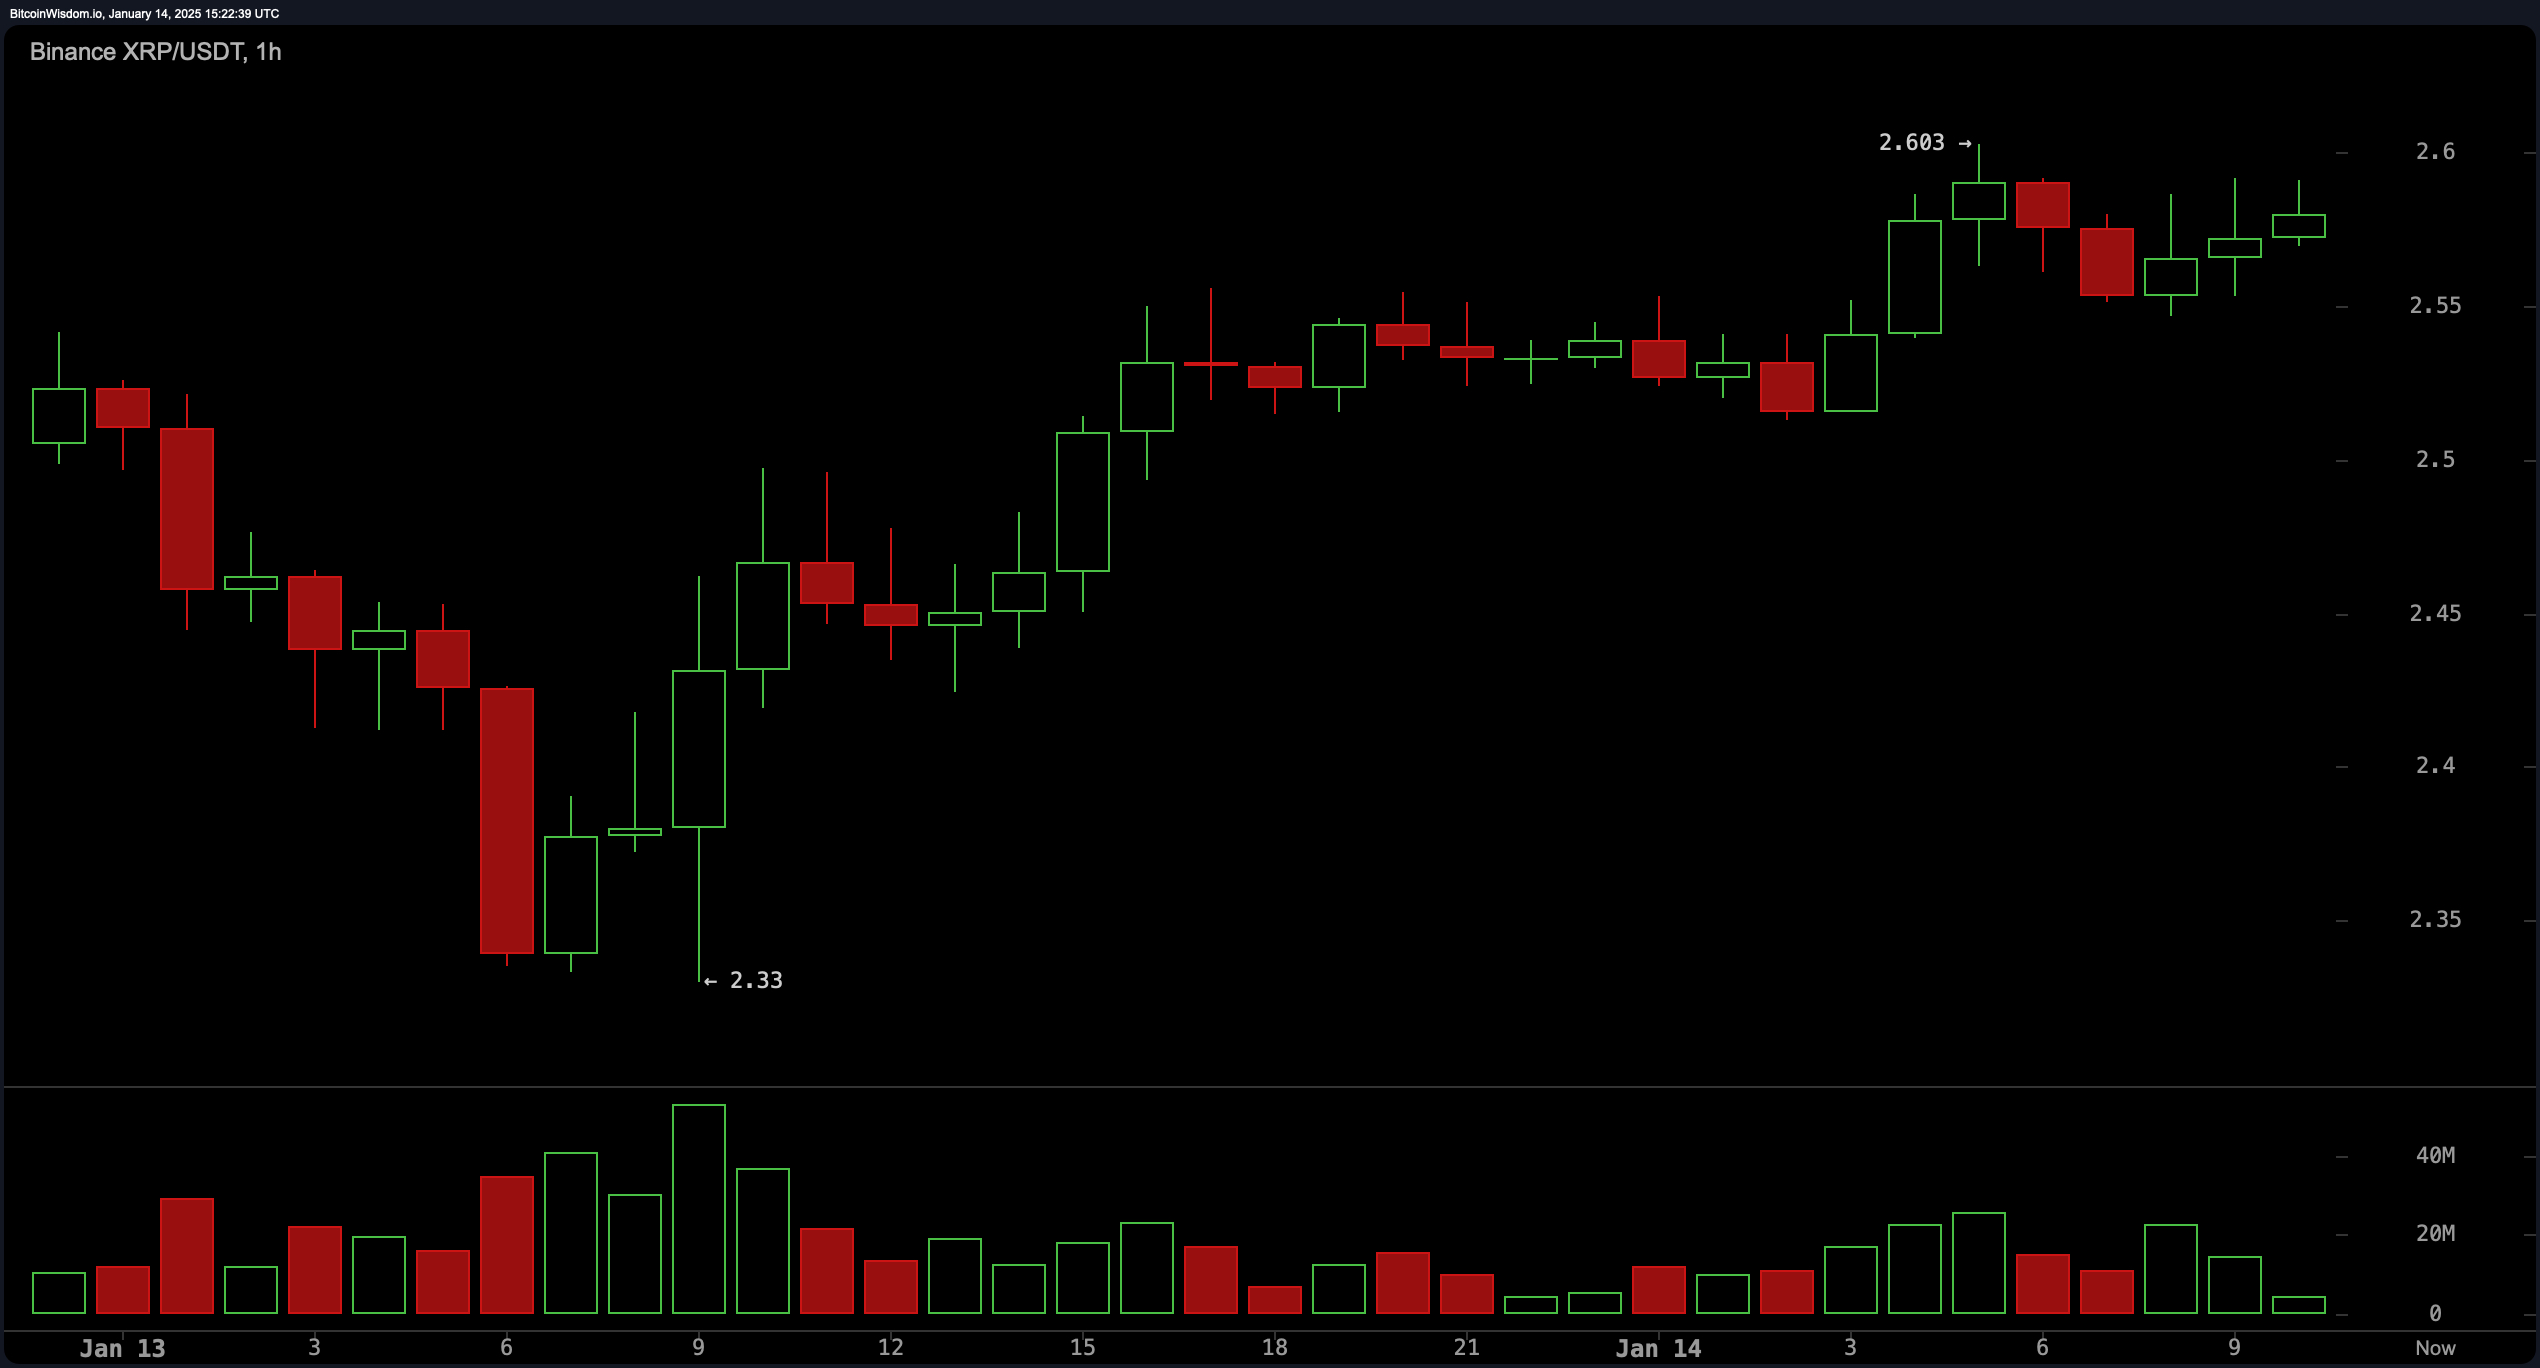
The one-hour chart shows short-term consolidation near the $2.60 resistance level, potentially forming a continuation pattern. Volume has slightly tapered during this consolidation, a typical precursor to significant price movements. Key resistance at $2.603 and support at $2.55 offer clear levels for entry and exit strategies, with a breakout above resistance confirming bullish continuation and a breakdown below support indicating short-term weakness.

Oscillators provide a mixed outlook, with the relative strength index (RSI) at 61.46 remaining neutral and the stochastic oscillator at 88.80 also neutral. The commodity channel index (CCI) stands at 130.54, indicating slight overbought conditions but not enough to trigger a sell signal. Meanwhile, the moving average convergence divergence (MACD) level at 0.09131 signals a buy, supported by positive momentum and moving average indicators showing strong bullish sentiment.
Moving averages (MAs) reinforce the bullish outlook, with all major exponential moving averages (EMAs) and simple moving averages (SMAs) across short- to long-term timeframes signaling a buy. The ten-period EMA and SMA at $2.44 and $2.42, respectively, and the 200-period EMA and SMA at $1.28 and $1.02, further highlight the sustained upward pressure. This alignment suggests XRP may continue its positive trajectory if resistance levels are breached.
Bull Verdict:
XRP’s current technical indicators and price action point toward a bullish continuation. The alignment of all major moving averages in buy territory, coupled with the formation of higher highs and higher lows on the daily chart, suggests sustained upward momentum. If resistance at $2.7 is decisively breached with strong volume, XRP could see further gains, potentially extending beyond its current trading range.
Bear Verdict:
Despite bullish signals, XRP faces potential risks if key support levels fail to hold. A breakdown below $2.4 on the daily chart or $2.45 on the four-hour chart could invalidate the bullish outlook. Neutral oscillator readings, coupled with reduced volume during consolidation, hint at possible market indecision. A failure to break resistance at $2.7 may lead to a reversal and increased downward pressure.
 news.bitcoin.com
