
- Hyperliquid ($HYPE) rose 4.85% to $20.98, with a market cap of $7.01B.
- RSI at 42.85 signals mild bearish momentum, with CMF showing modest inflows.
Hyperliquid ($HYPE) touched an intraday high of $21.22 before settling at $20.98. The price reflects a 5.03% gain over the last 24 hours. The trading volume surged 42.31% to $94.1 million, indicating heightened market activity.
Hyperliquid’s Market Cap ratio of 1.34% underscores significant trading activity relative to its market size. The recent integration into ElizaOS version 0.1.8, which supports Hyperliquid and other networks, highlights increasing adoption. This development could further bolster $HYPE’s position as a promising crypto asset.
Technical Indicators Signal Consolidation
The trading chart shows key resistance at $21.30 and support at $20.30. Breaking above $21.30 could propel the price toward $22.00 while losing the $20.30 support might push it down to $19.50. The Relative Strength Index (RSI) is at 42.85, trailing the 14-period average of 47.72. This suggests mild bearish momentum.
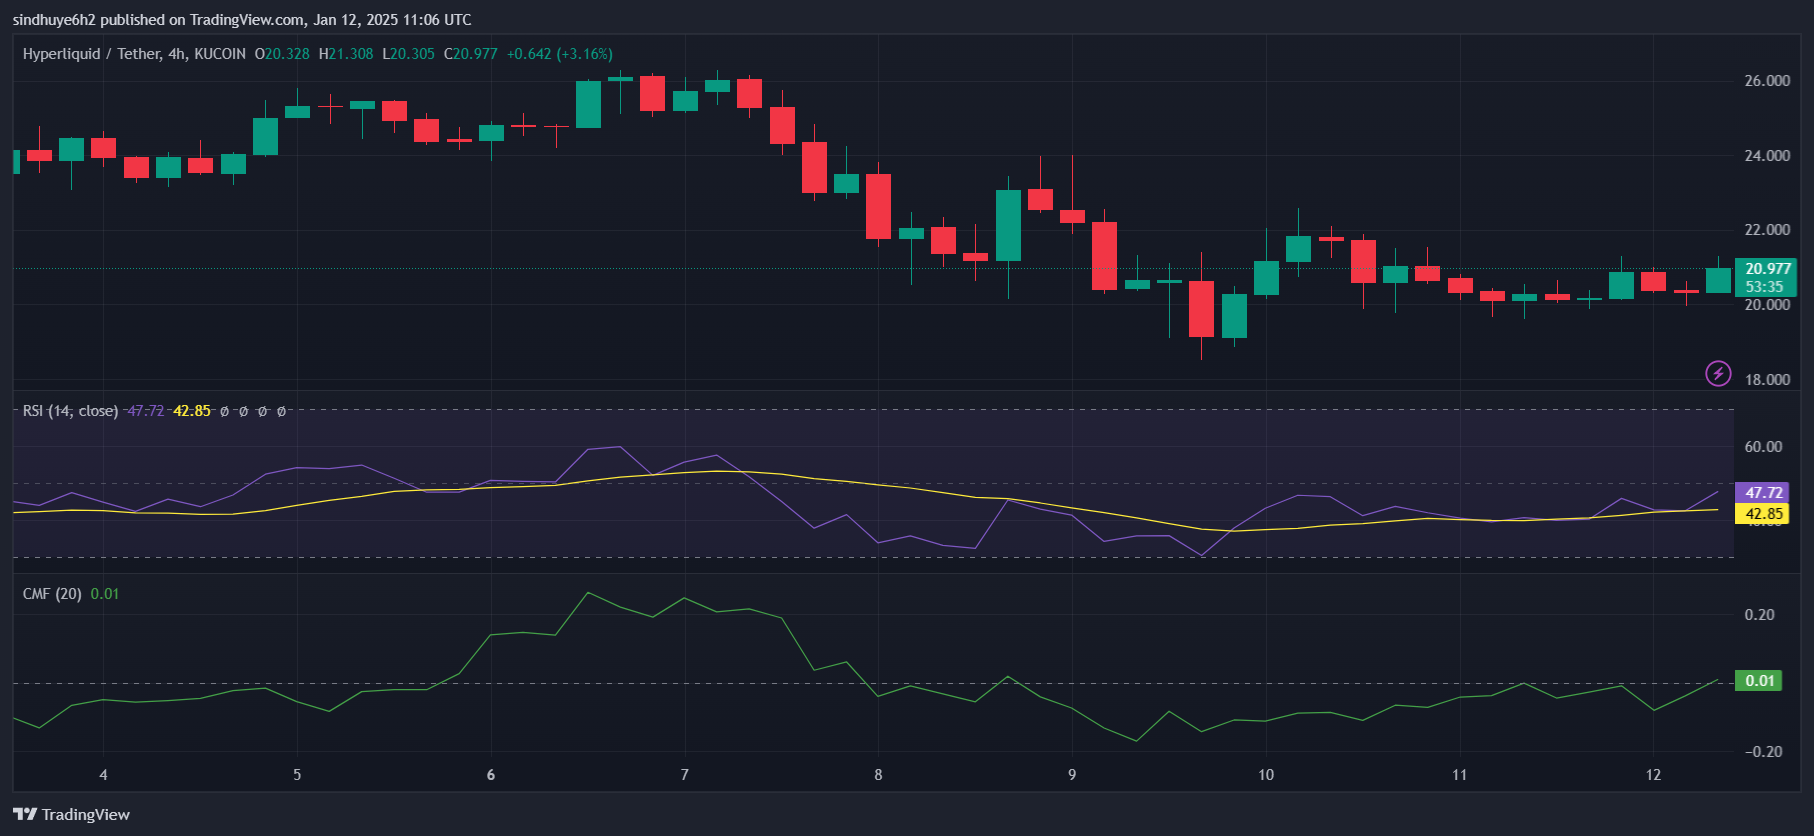
The Chaikin Money Flow (CMF) at 0.01 indicates modest capital inflows into $HYPE, signaling limited buying pressure. Moving averages reveal the 20-day EMA trending below the 50-day EMA, implying continued consolidation. The absence of a bullish moving average crossover suggests the current trend may persist.
If $HYPE surpasses $21.30, it may climb to $22.00, representing a 5% increase. However, failing to hold above $20.30 could lead to a decline toward $19.50. The RSI and moving averages suggest caution in the near term, but long-term prospects remain positive.