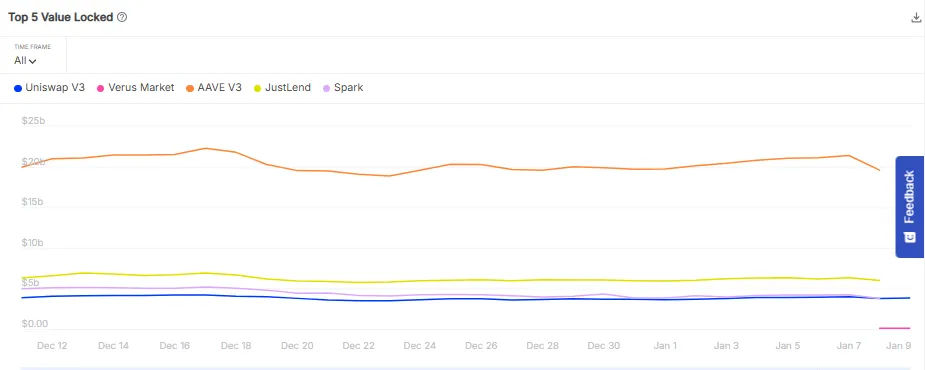
The chart showing “Top 5 Value Locked in DeFi platforms” distinctly highlighted AAVE crypto’s dominant position within the decentralized finance sector.
AAVE maintained a TVL (Total Value Locked) substantially higher than its competitors, consistently hovering around $20 Billion for the past month.
This significant gap underlined AAVE‘s robust market presence and investor confidence.
In contrast, Uniswap V3, Verus Market, JustLend, and Spark demonstrated much smaller TVLs, ranging between $5 Billion and below $500 Million.
The relative flatness of their lines from early December to early January suggested stability but also indicated a lack of substantial growth compared to AAVE crypto.

AAVE’s predominance not only showed its critical role in the DeFi ecosystem but also suggested a greater trust and utility perceived by users.
Its lead in TVL could imply a stronger resilience and innovation in offering effective financial solutions on the blockchain.
This dominance points to AAVE as a potential safer harbor during market fluctuations, especially in the broader context of the crypto market’s volatility.
Profitability of Active Addresses
The profitability distribution of active AAVE addresses, with a detailed breakdown showed the price ranges where addresses were “In the Money,” “At the Money,” and “Out of the Money.”
This analysis identified the support and resistance levels for AAVE. The current price of AAVE, at $283.23, served as a crucial mid-term support, yet with 62.71% of addresses “At the Money” around this price, there is a vulnerability.
The highlighted 18.29% of addresses “In the Money” and 19% “Out of the Money,” suggesting a relatively balanced distribution.

However, with a significant portion of addresses nearing the break-even point, any decline below $282 could shift a larger segment into the “Out of the Money” category.
Should AAVE’s price fall to the next significant level around $210, as the distribution suggests, we might see an increased selling pressure due to the shift in profitability status.
This dynamic could potentially lead to further price declines if the $282 support level does not hold, indicating the importance of this level in AAVE’s price stability.
AAVE’s Future Price Action
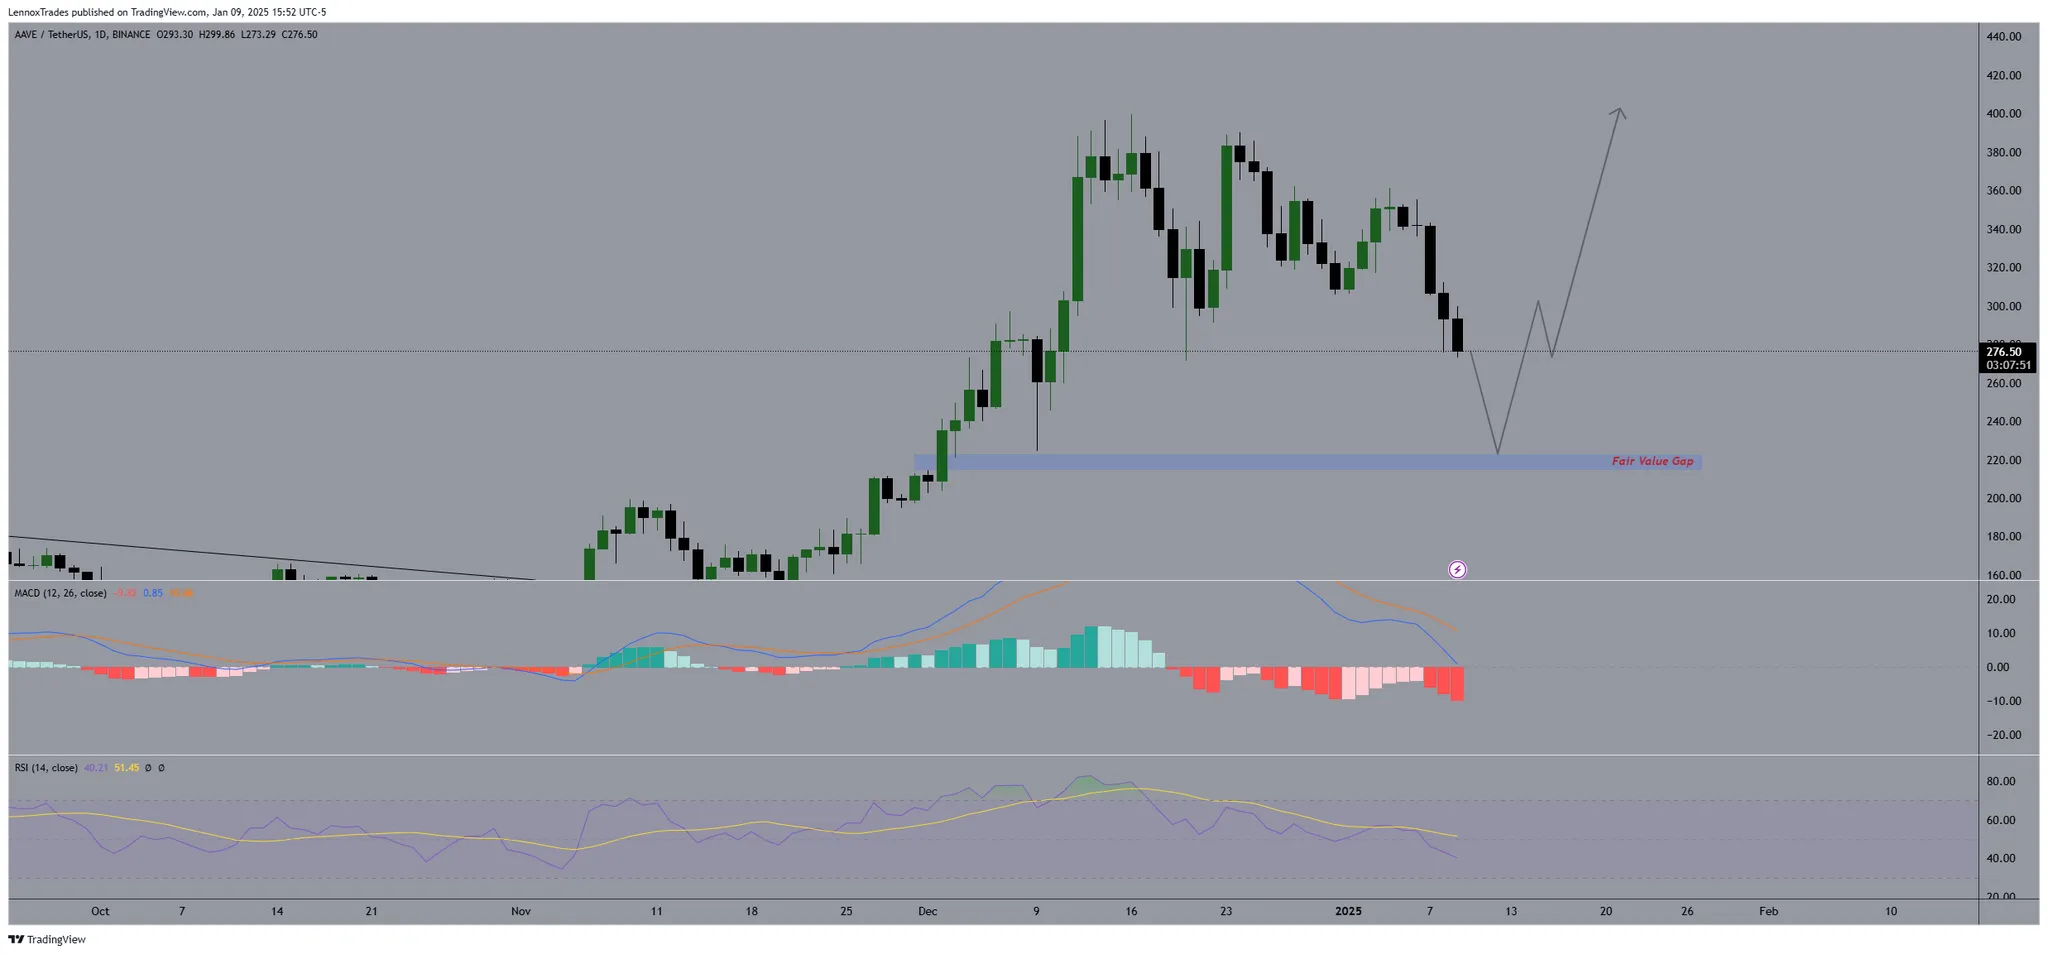
Furthermore, AAVE/USDT significantly tested points highlighted by the current price of $276.50, just above a pivotal support level. Previously, AAVE saw a steep ascent, with prices reaching as high as $420.
Following this peak, the price of AAVE entered a correction phase, descending toward the noted support level around $276.50.
The MACD was trending below the signal line, indicating bearish momentum, while the RSI was near the 51.45 mark, suggesting a neutral to slightly bearish sentiment in the market.

The “Fair Value Gap” between $210 and $160 suggested potential lower support levels, which could be tested if the current support fails to hold.
The price action formed what appears to be a descending channel, with the recent downtrend testing the support at $276.50.
If this level fails, the analysis suggests a possible decline to $210, as indicated by the gap analysis.
Conversely, a rebound from this support could see prices attempting to recover higher levels, potentially retesting previous highs.
AAVE’s short-term price trajectory amidst market corrections could be determined with substantial attention on how it maintains above $276.50 or adjusts to find new lows.
 thecoinrepublic.com
