Digital assets remain in the red as Bitcoin hovers below $95K after its recent plunge from above $100K.
Ethena saw its value decline over the past few days, and a 7% price dip in the past day plunged its market cap beneath $3 billion.
The altcoin’s market capitalisation has hovered around the $3 billion mark since dropping from $3.88 billion on January 6.
The metric stood at $2.84 billion at the time of writing.

Meanwhile, a technical outlook suggests more pain for ENA.
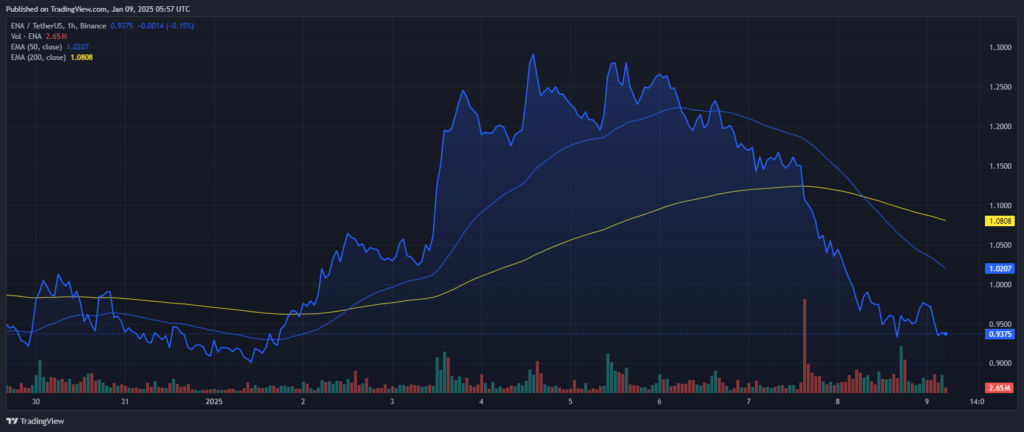
For instance, the Exponential Moving Average lines display a dangerous formation, with a death cross on the 1H chart.
The bearish technical setup happens when short-term Exponential Moving Averages cross beneath longer-term EMAs.
Ethena’s 50-day EMA has diverted below the 200-day EMA on the 1H chart.

The same trend could happen in other timeframes as bears dominate.
Meanwhile, the prevailing situation signals substantial bearishness for the altcoin.
Thus, ENA could fall towards the support barrier at $0.89.
Failure to hold this foothold would open the path to $0.75. That would mean a 20% slump from current prices.
ENA price: RSI and CMF insights
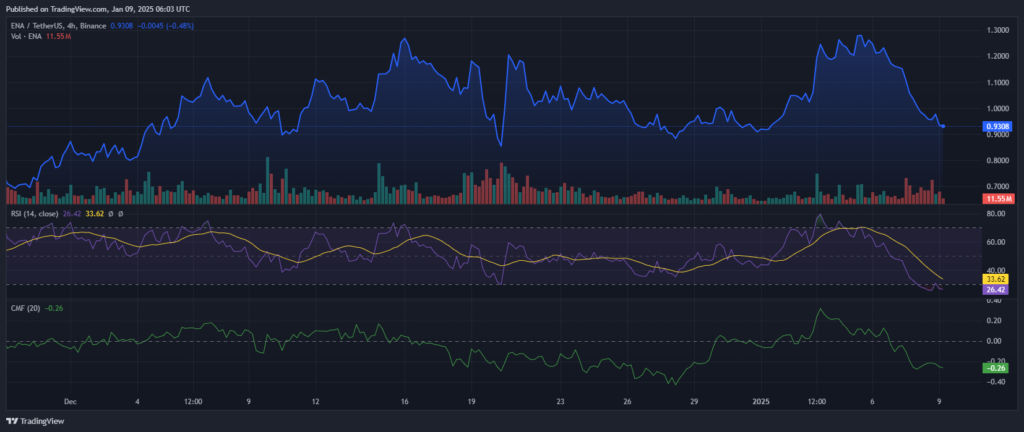
The 2H Relative Strength Index reads 26.47 after dipping to 16.31 late yesterday.
The current values represent the lowest RSI since August last year.
The RSI momentum indicator measures the strength and speed of price actions on a 0 to 100 scale.
Values beyond 70 highlight overbought situations and possible price retracements.
Meanwhile, readings beneath 30 confirm oversold conditions, signaling potential price recoveries.
The substantial dip from 66 on Monday suggests a notable change in market sentiments, with sellers dominating this week.
However, the prevailing RSI readings place ENA in an oversold region, indicating possible bear exhaustion.
Such trends catalyze significant price rebounds upon buyer resumptions.
Nonetheless, the Relative Strength Index’s momentum signals waning investor confidence.

The Chaikin Money Flow adds credence to ENA’s bearish outlook.
The indicator has plummeted from 0.33 on January 3 to -0.26 at press time.
The CMF indicator gauges cash flow in and out of an asset.
Positive figures suggest buying momentum, signalling buyer revival, whereas negative values indicate seller activity.
The swift plunge to the negative value confirms a substantial market sentiment shift, matching ENA’s price dips.
ENA’s current price action
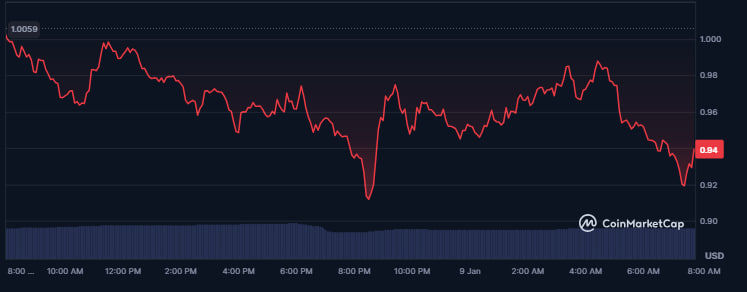
Ethena trades at $0.94 after losing over 6% in the past 24 hours.
Trading volumes for the coin have gone down around 6% to $582 million.

Intensified bearishness within the past day plunged the alt beneath $1, and it appears poised for more dips before possible recoveries.
Bearish technical indicators support ENA’s downward trajectory.
The token could slump to December 20, 2024, lows of $0.8608.
Failure to hold this mark would trigger significant price declines.
However, the RSI’s oversold conditions suggest potential rebounds at current regions.
A bull resurgence could propel Ethena toward the $1.01 resistance. Extended recoveries would clear the path to $1.12 and $1.31.
The post ENA price outlook: Ethena forms a risky pattern as market cap dips below $3B appeared first on Invezz
 invezz.com
