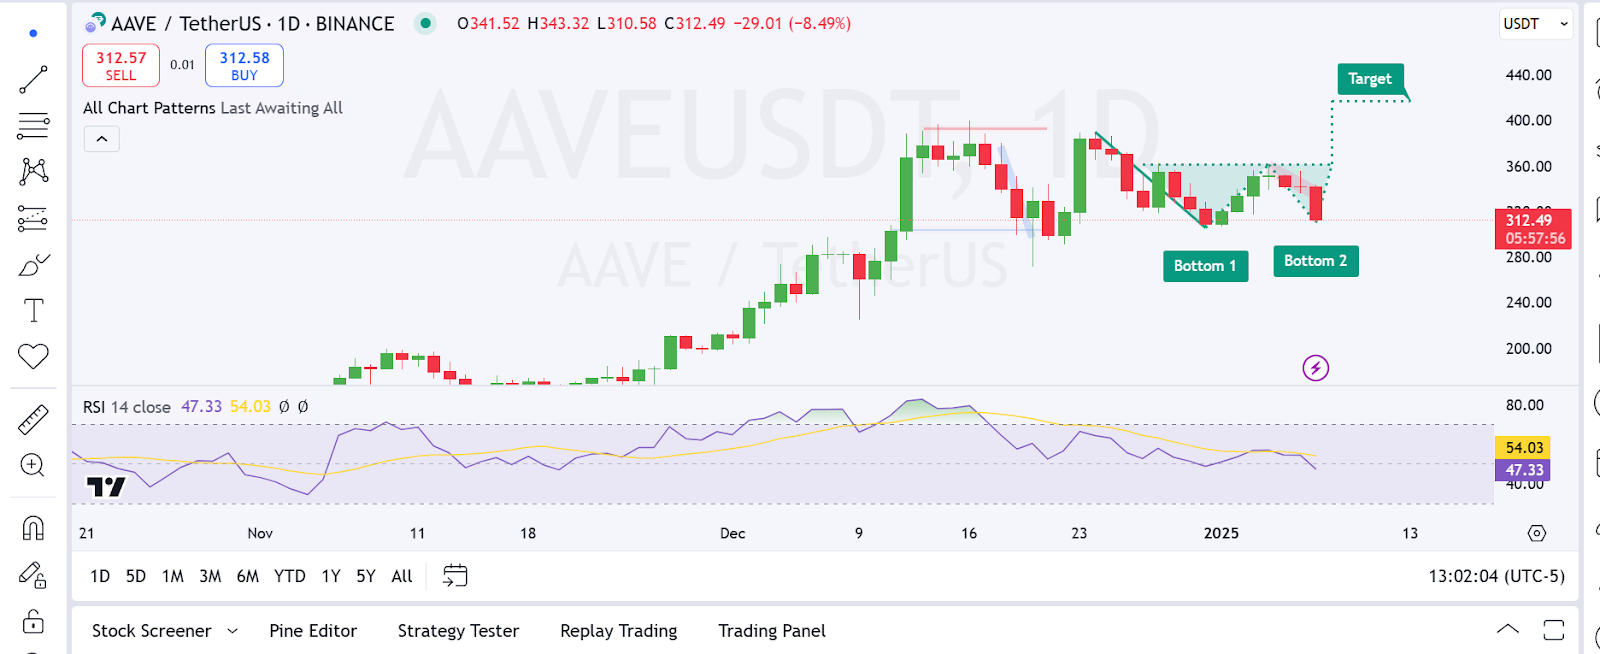
AAVE crypto is currently consolidating within a symmetrical triangle pattern, indicating reduced volatility and potential for a decisive breakout. According to analysts, the token is preparing for a significant move. Fibonacci retracement levels and momentum indicators seem to support a bullish scenario.
The pattern could result in an upward trend toward key resistance levels. Potential targets are set at $392.45, $466.42, and $531.84.
AAVE Crypto Sees Symmetrical Triangle Indicates Consolidation
The chart pattern shown is a symmetrical triangle. This pattern forms when the price range bounds between two converging trend lines and suggests a period of consolidation.
This pattern frequently is a continuation pattern that indicates that the market is likely to break out in either direction depending on the momentum and volume behind the breakout.
Experts also note that the majority of indicators and sentiments are pointing towards a bullish breakout. Such a breakout would be defined by a move and hold above the descending triangle’s resistance at $286.
The Levels to Watch for Support and Resistance
The current price action of AAVE crypto suggests clear support and resistance levels. Target at $232.28, which is accompanied by the 0.786 Fibonacci retracement level, is considered to be the key target for the buyers. This level is considered to be a perfect entry level for traders who plan to open positions expecting the price to rise through this level.
On the flip side, the first target is $392.45 to be reached and it is the first stop at the resistance level after breakout. More resistance is seen at $466.42 and $531.84, the upper end of which represents the bull target.
Double Bottom Pattern supports the Bullish View
The chart also depicts a double bottom formation, which is a bulls defined pattern that typically emerges at the end of a bearish trend signaling the beginning of a bullish trend. There are two clear cut lows at the $280 level and resistance at the neckline at $360.

If AAVE crypto moves above the neckline, the double bottom formation will be confirmed, and the focus should turn to $440. Experts believe that the price of $360 is a key level that needs to be broken for the bullish scenario to come true.
Analysing the Momentum Indicators and Volume Trends
AAVE is trading at $312.49, down 8.49% for the day. The drop could reflect profit-taking or testing of nearby support levels. Momentum indicators such as Relative Strength Index (RSI) also gives an idea of the direction which AAVE might take.
Currently, the RSI is at 47.33, indicating that the momentum is neutral with no overbought or oversold levels. Any level above 60 will suggest further increase in the bullish pressure, which is in line with the breakout view.
The same is also revealed by volume trends where buying pressure is also seen to ease during consolidation. As such, a breakout above $286 or $360 with volume support will confirm the bullish trend. On the other hand, lack of continued high volume may slow down the upward movement or even lead to further consolidation.
Will Bulls or Bears Take Control of AAVE Crypto?
If AAVE sustains above $232.28 and retests and breaches through the triangle resistance and the neckline at $360 it may cause a massive upward move.
Topside intraday resistance targets at $392.45, $466.42, and $531.84 have been maintained with adequate volume and rising momentum.
A move below $232.28 would shake the bulls out of the market and could extend the selling to the $250 level.
 thecoinrepublic.com
