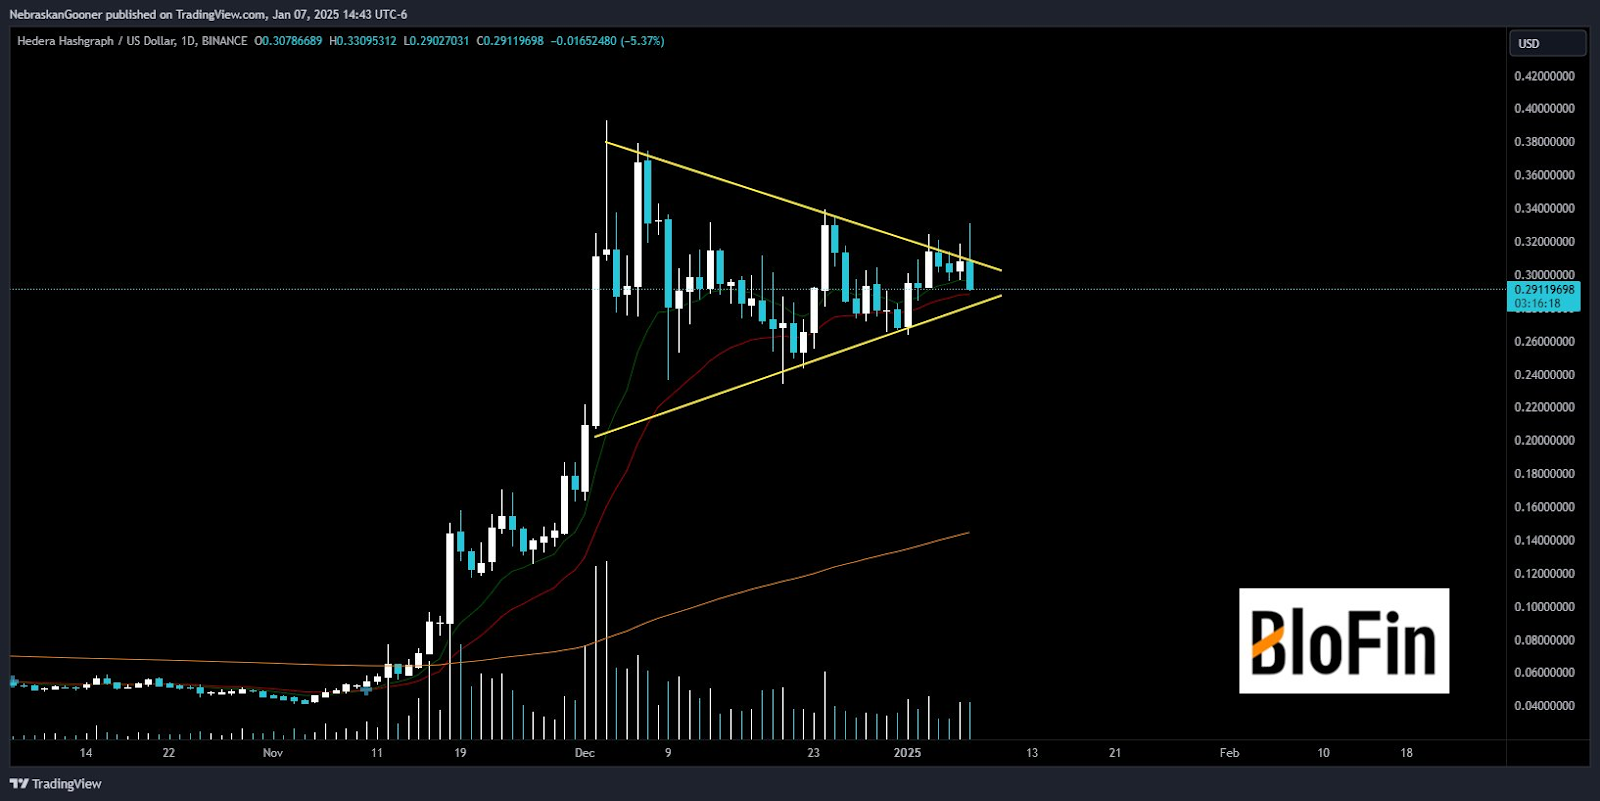
- HBAR is trading within a symmetrical triangle, signaling possible sharp movement soon.
- The price is at $0.291 and consolidating, creating uncertainty among buyers and sellers.
- A breakout with high volume could confirm HBAR’s next trend in either a bullish or bearish direction.
Hedera Hashgraph is trading within a symmetrical triangle, which could signal a sharp price move in the coming days. Currently priced at $0.291, the token has dropped 5.37% today.

Source : X
Triangle Pattern Signals Consolidation Before Major Movement
The daily chart for HBAR reveals a symmetrical triangle formed by converging trendlines, indicating that the economy is balancing. This pattern is often associated with uncertainty in the market as buyers and sellers wait for a breakout. The price has been making lower highs and higher lows within the triangle, which suggests a decision point is approaching.
Respected analyst NebraskaGooner highlighted the importance of the triangle, advising traders to watch for a breakout on either side. The market movement could depend on whether the daily candle closes above or below the trendlines. Additionally, the 50-day and 200-day moving averages have emerged as danger zones that traders should monitor.
Community Reacts to Potential Breakout with Varied Predictions
Discussions about the token’s valuation have sparked debate among traders, with some predicting a bearish correction and others anticipating bullish momentum. One user on Twitter expressed concerns, suggesting a price drop to $0.14. Meanwhile, another trader viewed the current pattern as a possible bull flag and proposed that HBAR may need to test lower levels before moving higher.
NebraskaGooner emphasized the importance of monitoring trading volume, as a spike during a breakout would confirm the direction of the next move. This ongoing debate highlights the market’s mixed sentiment as traders prepare for increased volatility.
Key Technical Indicators Point to Imminent Price Action
The symmetrical triangle has developed alongside declining trading volume, which aligns with the characteristics of this pattern. A significant breakout in either direction would likely be accompanied by a sharp increase in trading activity.
The 200-day moving average provides a critical support level, while resistance is evident from the multiple price rejections near the top trendline. Traders are closely monitoring whether HBAR will break above resistance to regain bullish momentum or fall below support, signaling further downside.
This pattern suggests that HBAR is on the verge of a move, and the outcome may shape its trend for weeks ahead.
