XRP is trading at $2.19 to $2.25 over the last hour, with a 24-hour trading volume of $7.85 billion, a market cap of $127 billion, and an intraday price range of $2.21 to $2.35, reflecting notable bearish trends across all major timeframes.
XRP
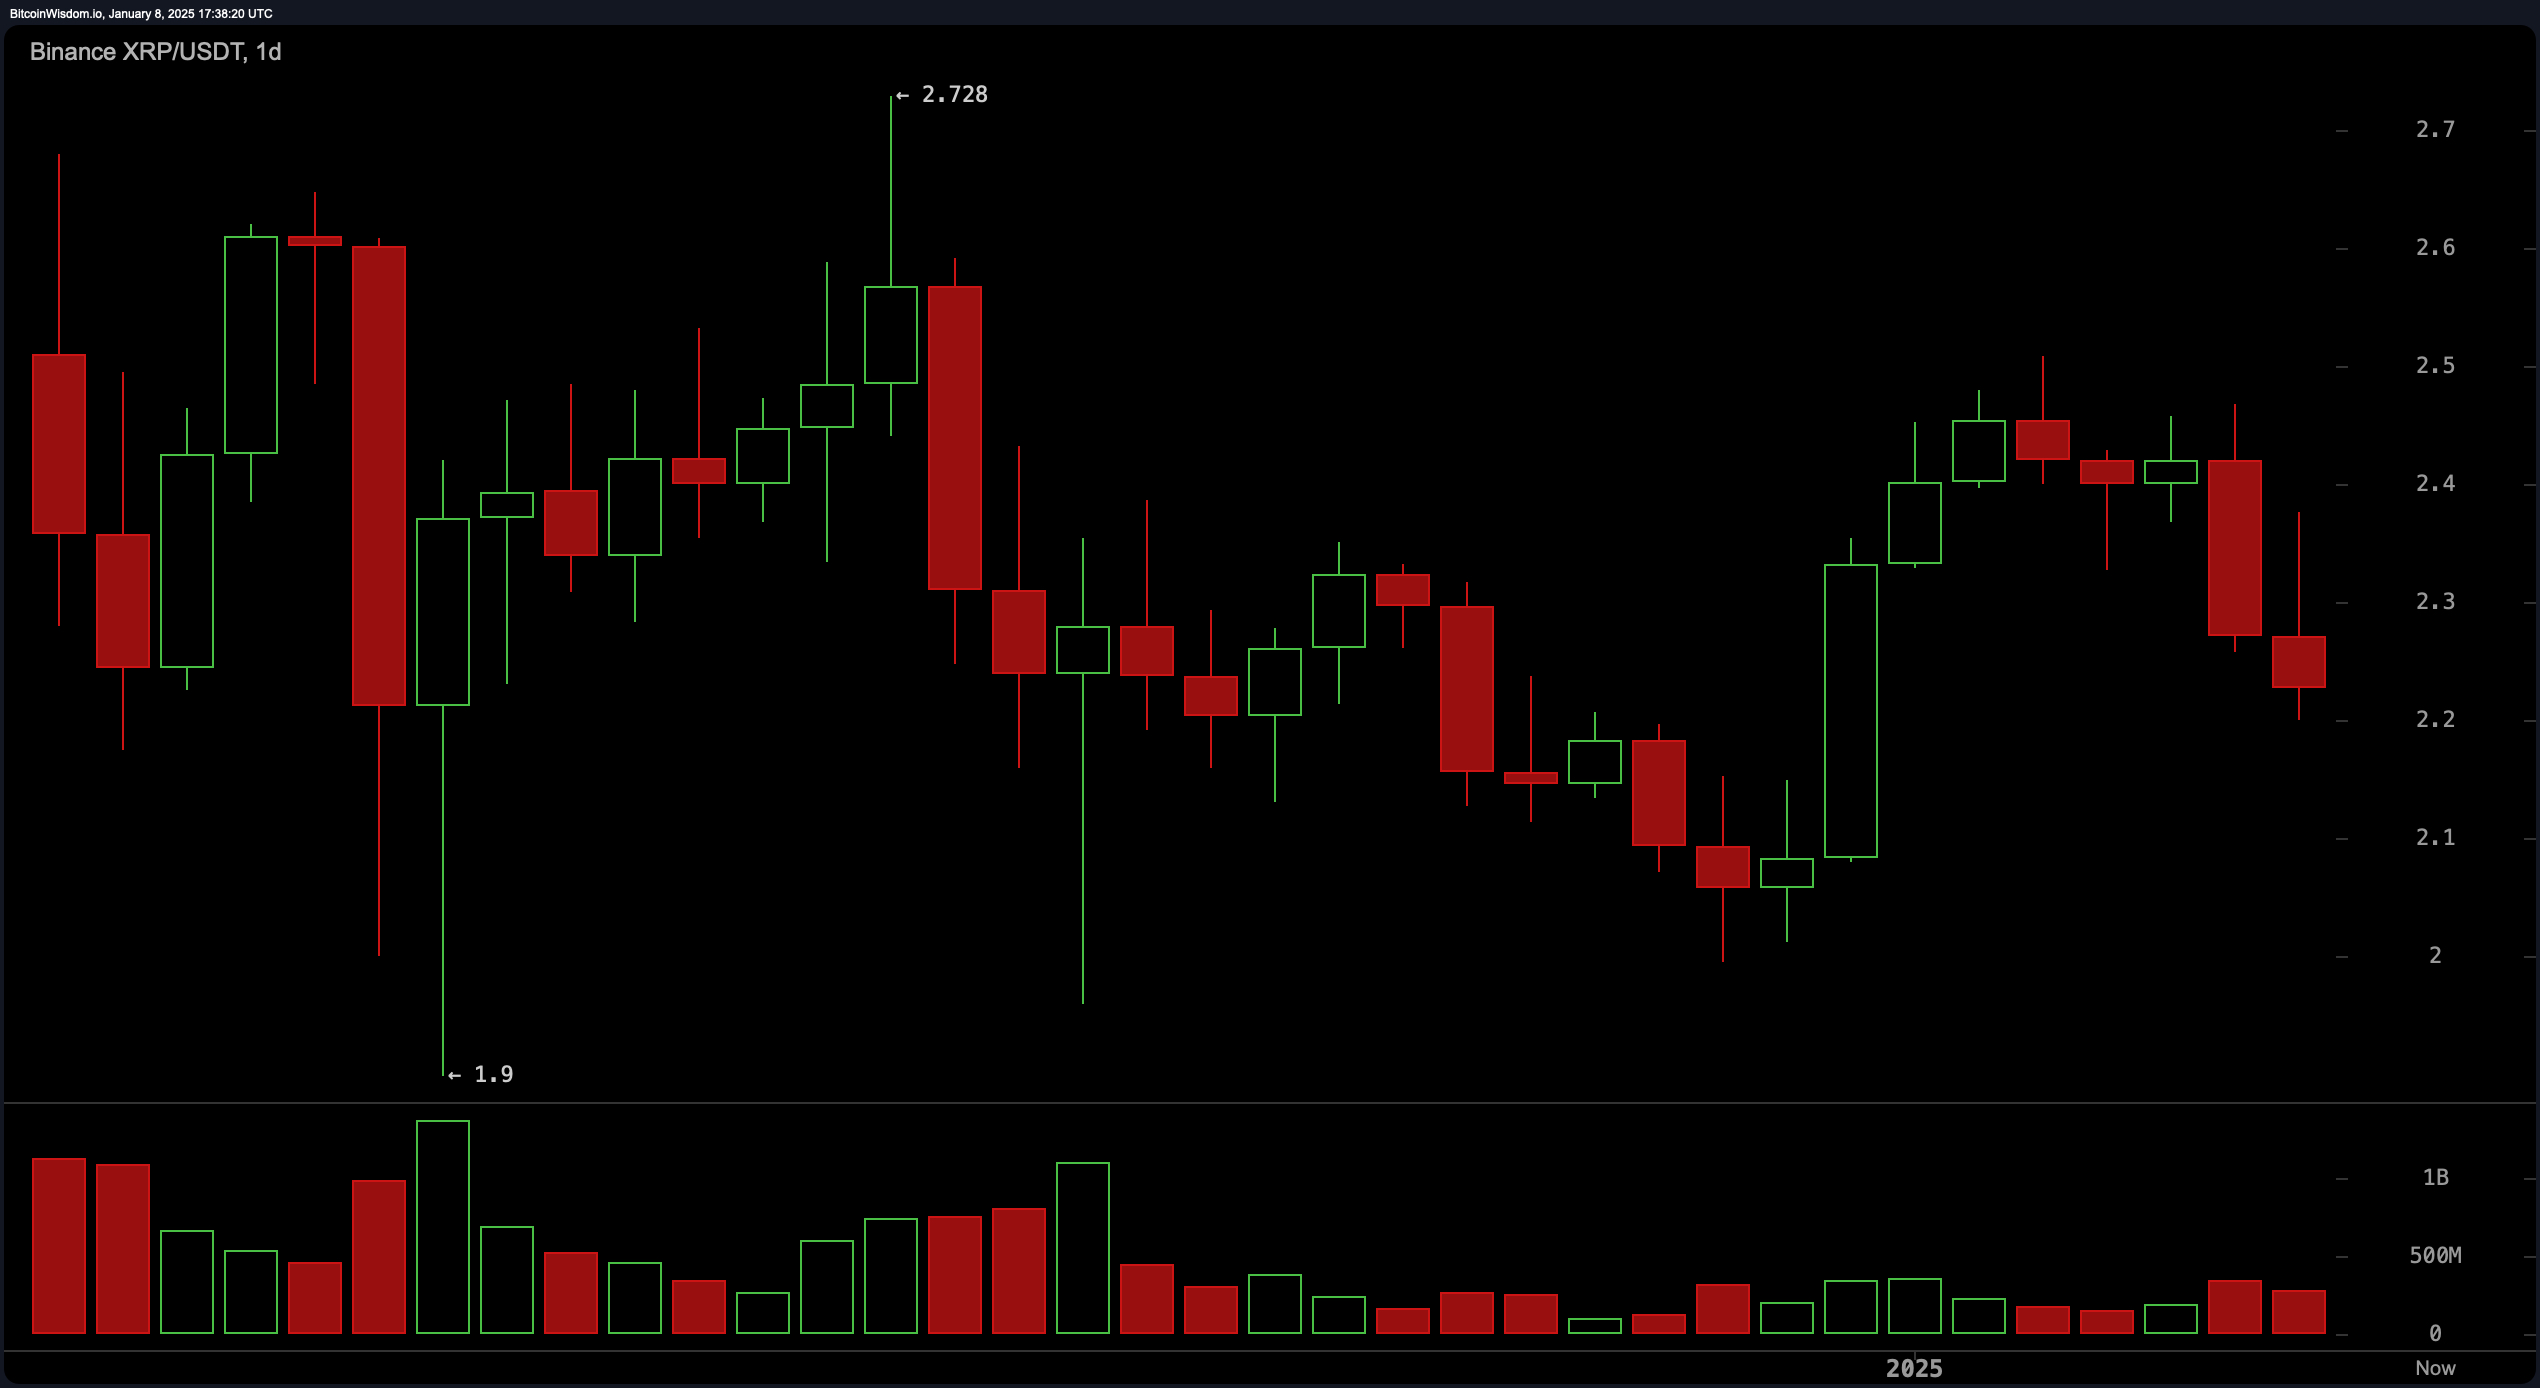
XRP’s daily chart demonstrates a prevailing downtrend, with consistent lower highs and lower lows indicating sustained bearish momentum. Significant resistance lies between $2.4 and $2.5, while support is found near $2.2. The large red candles with high trading volumes suggest intensified selling pressure, further supporting the bearish outlook. Buyers appear hesitant, as evidenced by reduced volume during recovery attempts.

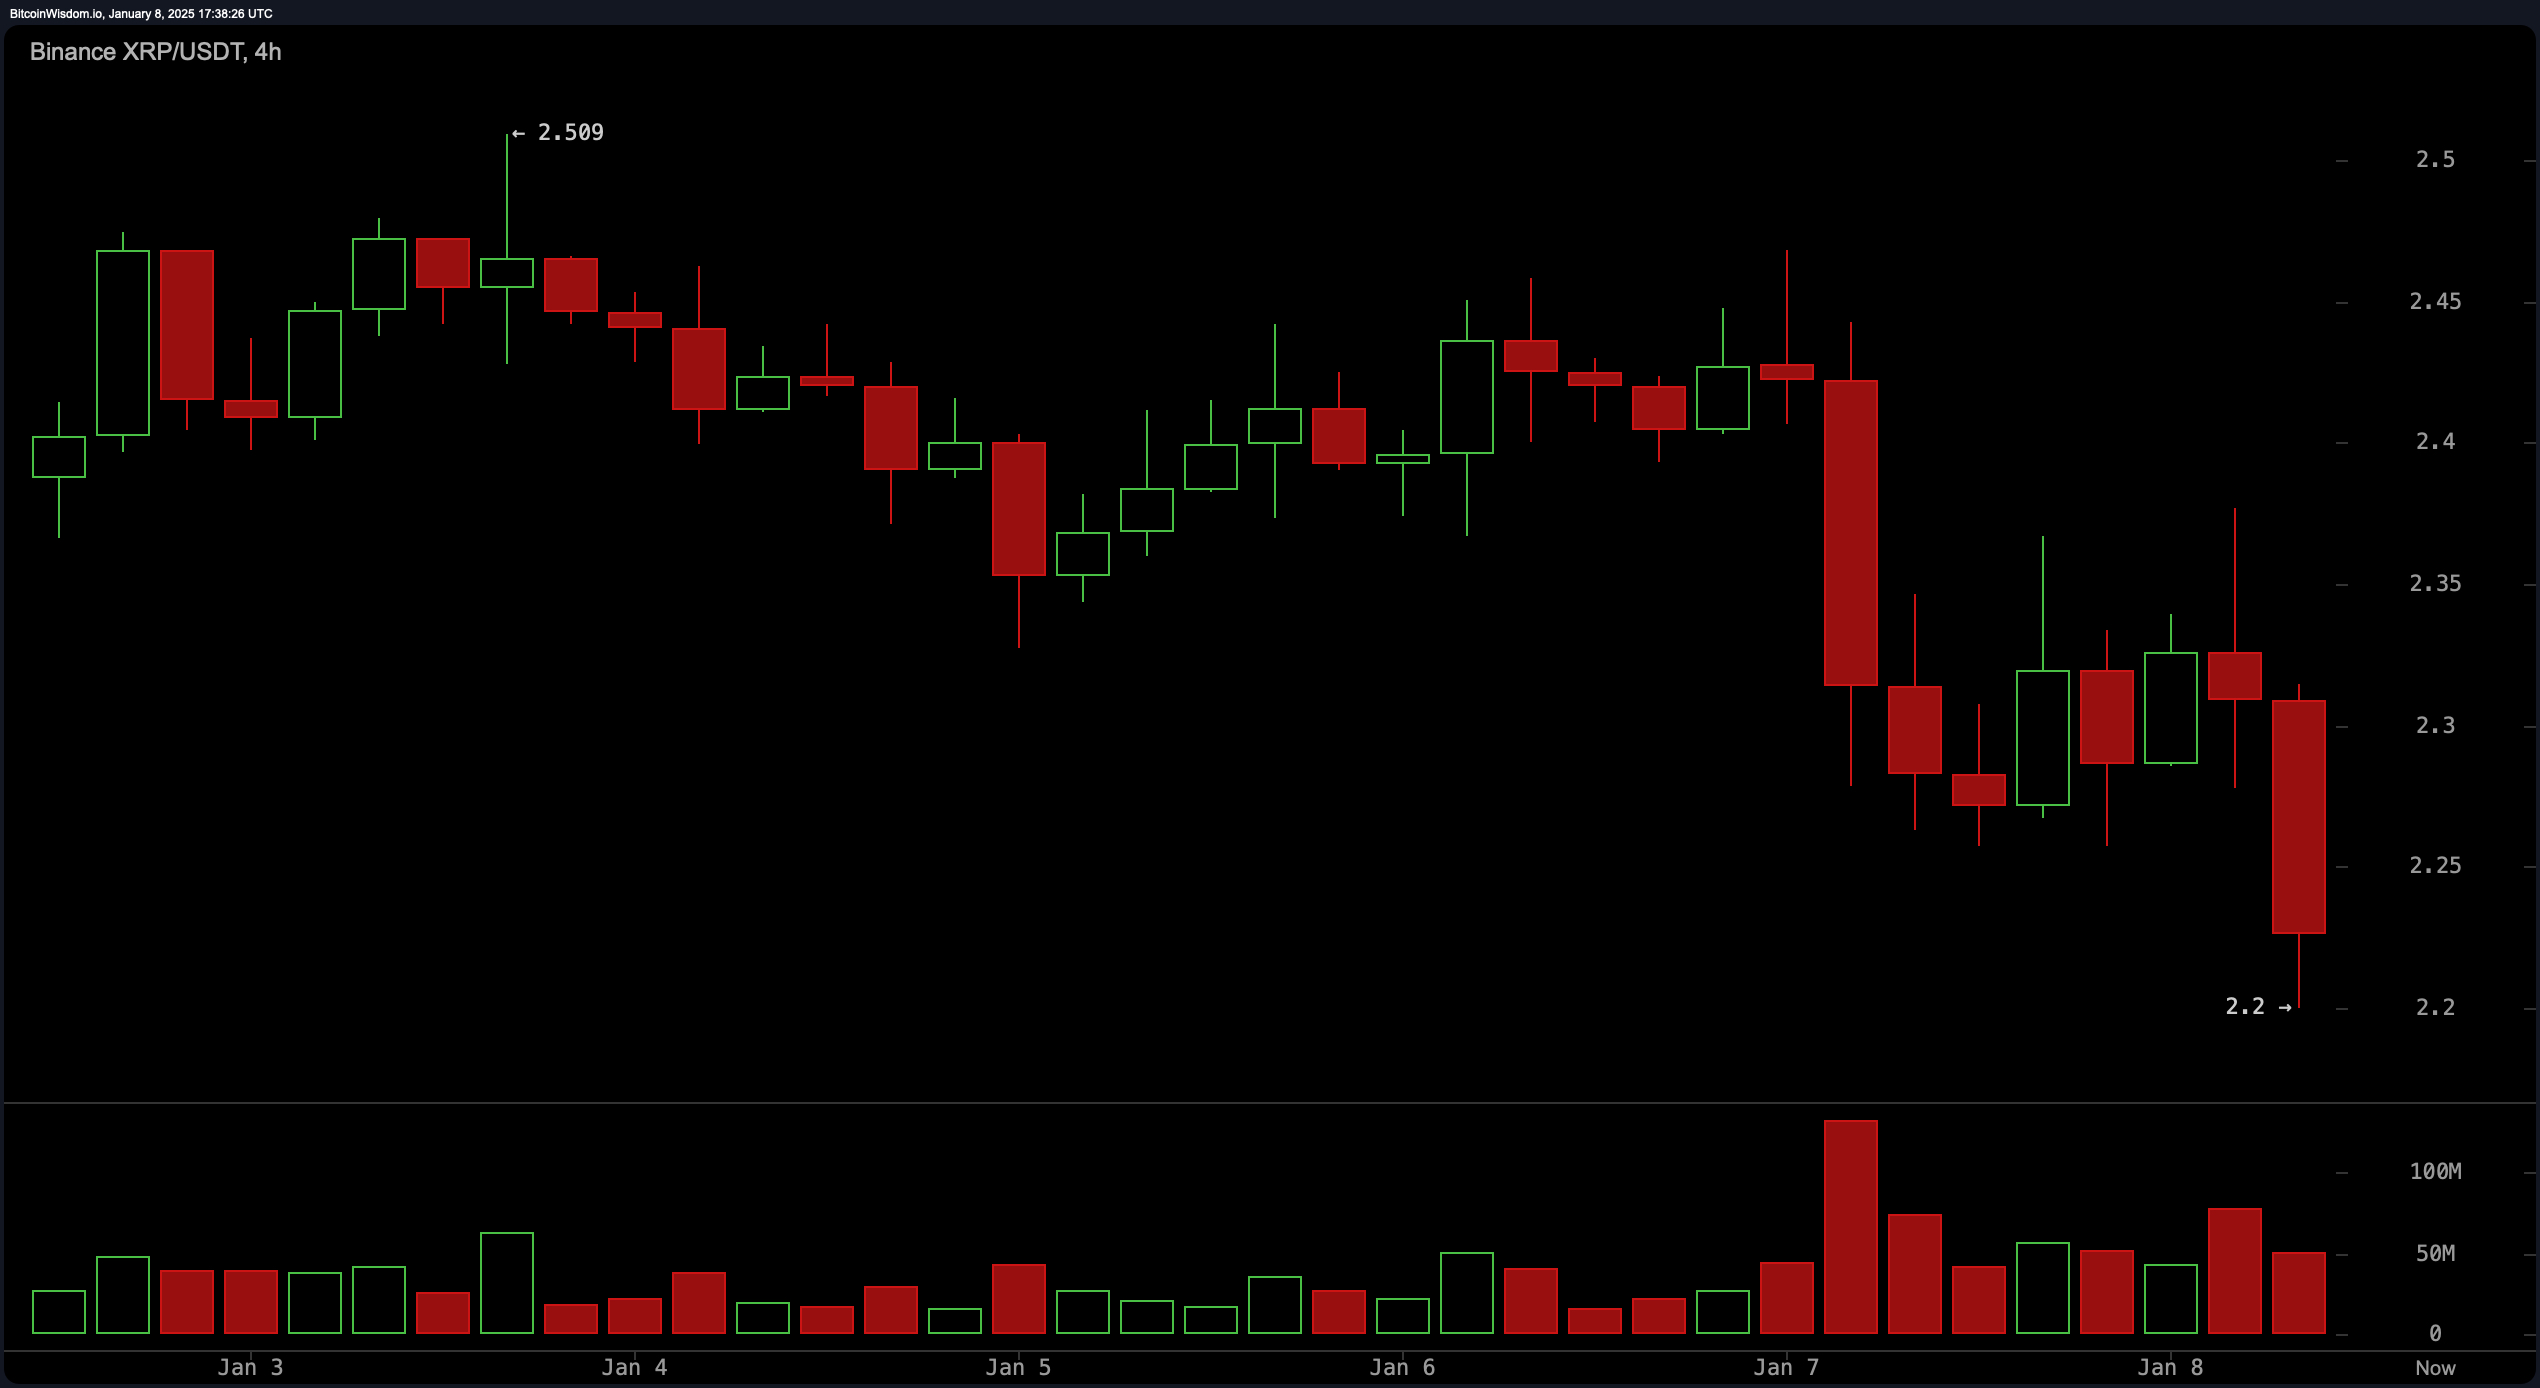
On the 4-hour chart, XRP faces consistent rejection near the $2.4 to $2.45 range, further affirming it as a strong resistance zone. A recent steep decline pushed the price to the $2.2 level, where a potential short-term support has formed. Weak buying interest during minor recovery phases suggests the continuation of bearish sentiment, with only a brief bounce likely near the $2.2 support.

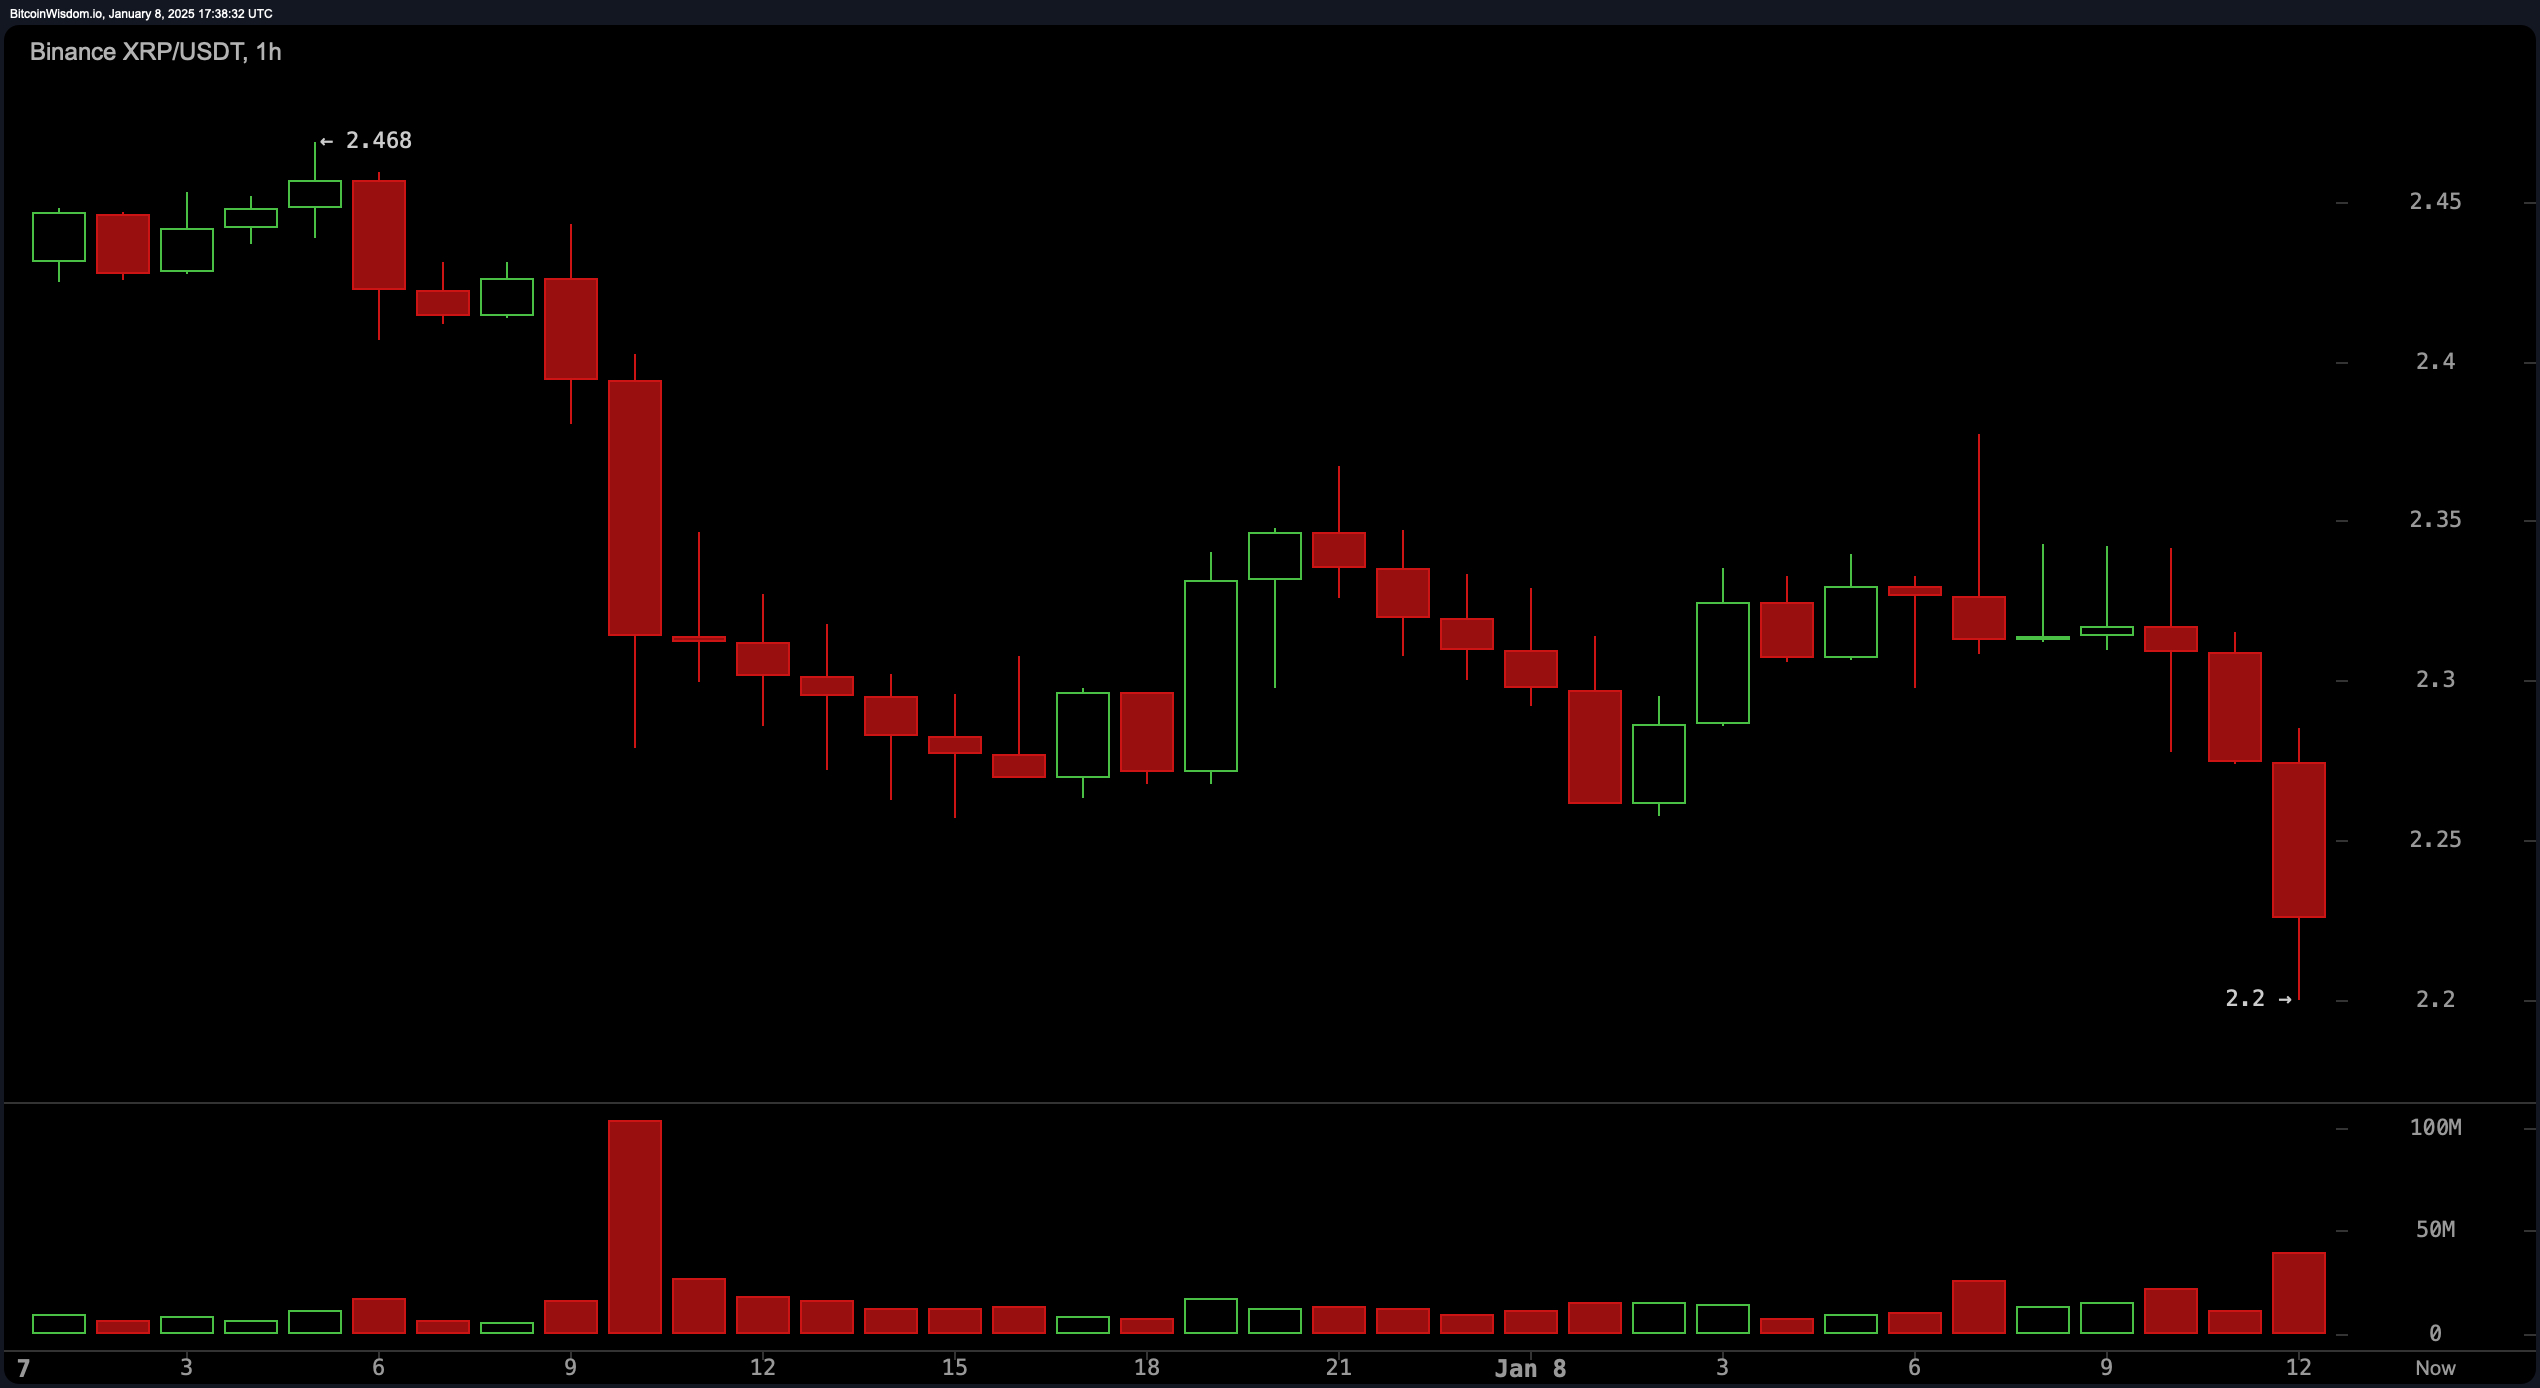
The 1-hour chart indicates a decisive breakdown from the $2.3 range, accompanied by increasing volume, reinforcing the overall bearish sentiment. Short-term oversold conditions could trigger a minor relief rally, but the prevailing trend remains firmly bearish. Consolidation phases followed by breakdowns highlight the potential for further declines unless significant buying volume emerges.

XRP’s oscillator readings paint a mixed picture, with the relative strength index (RSI), Stochastic oscillator, commodity channel index (CCI), average directional index (ADX), and awesome oscillator all indicating neutral sentiment. However, momentum shows a buy signal, while the moving average convergence divergence (MACD) suggests a sell signal, aligning with the broader bearish trend.
Moving averages provide further evidence of a bearish outlook, with the exponential moving average (EMA) and simple moving average (SMA) on the 10, 20, and 30 periods signaling sell actions. The 50, 100, and 200-period moving averages show buy signals, indicating potential long-term support. However, short-term dynamics dominate, favoring caution in positioning.
Bull Verdict:
While XRP faces significant bearish momentum in the short term, a strong rebound from the $2.2 support level, combined with buy signals from long-term moving averages, could pave the way for a recovery toward the $2.4 to $2.5 resistance range. A decisive break above these levels with strong volume would signal a potential bullish reversal.
Bear Verdict:
XRP’s consistent rejections near resistance zones, weak buying interest during recoveries, and bearish signals across short-term moving averages and the moving average convergence divergence (MACD) suggest the downward trend will persist. Unless the price convincingly reclaims $2.4, the market remains firmly under bearish control, with further declines likely below $2.2.
 news.bitcoin.com
