The bears are in total control of today’s session, as seen from the decrease in the global market cap. The total cap stood at $3.33T as of press time, representing a 7.27% increase over the last 24 hours, while the trading volume jumped by 43.6% over the same period to stand at $179.5B as of press time
Bitcoin Price Review
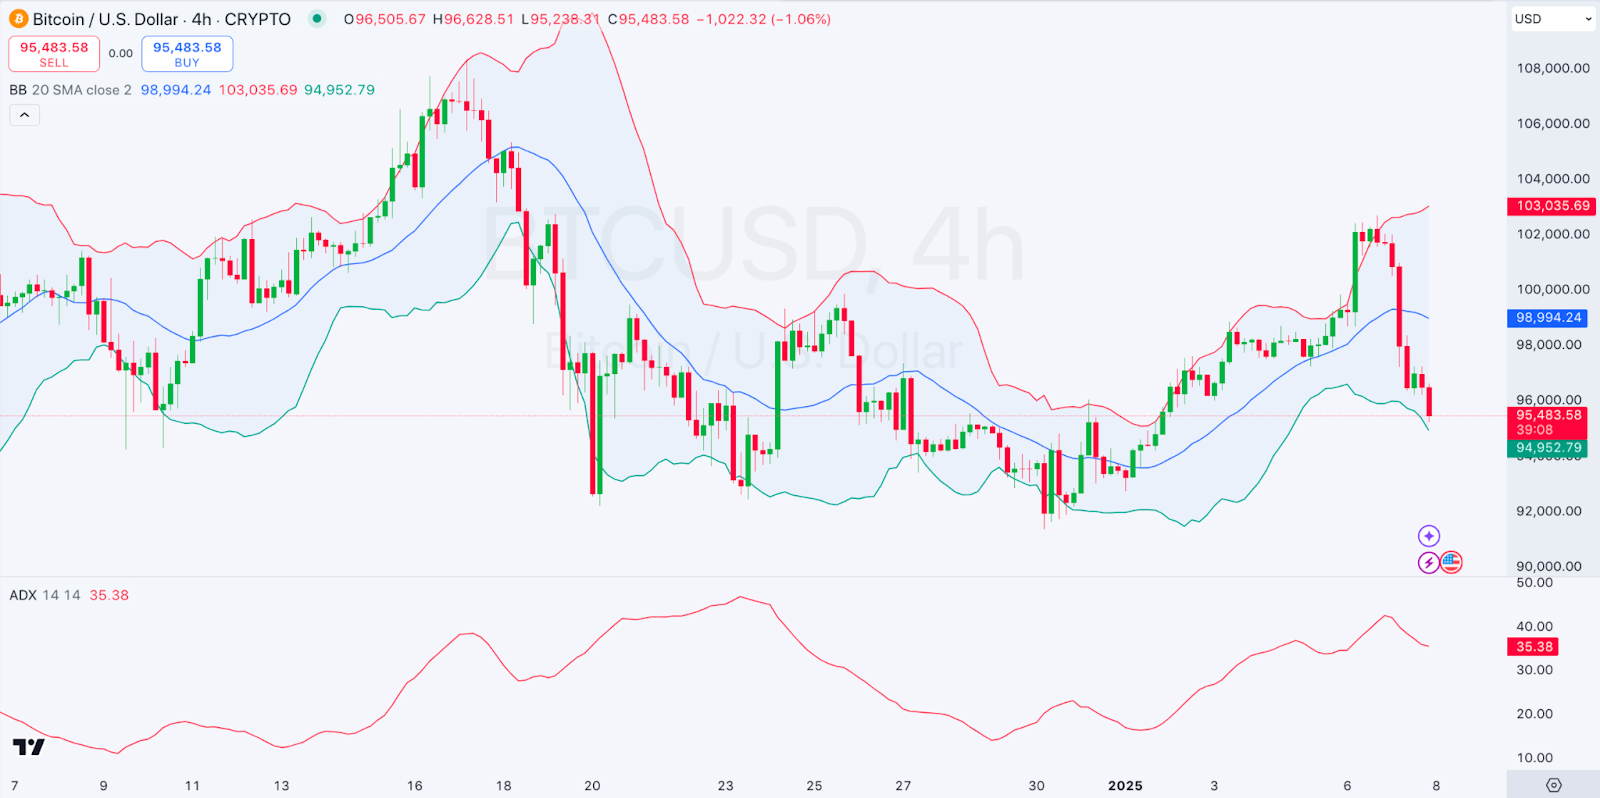
Bitcoin, $BTC, posted a notable drop in today’s session, as seen from its price movements. Looking at an in-depth analysis, we see that BTC is testing the lower Bollinger Band, indicating strong bearish pressure.
On the other hand, we see that the ADX (Average Directional Index) is at 35.38, signifying a strong trend. A potential bounce may occur near the lower band ($94,952), but if breached, it could signal further downside. Bitcoin traded at $95,417 as of press time, representing a 6.28% decrease over the last 24 hours.
Ethereum Price Review
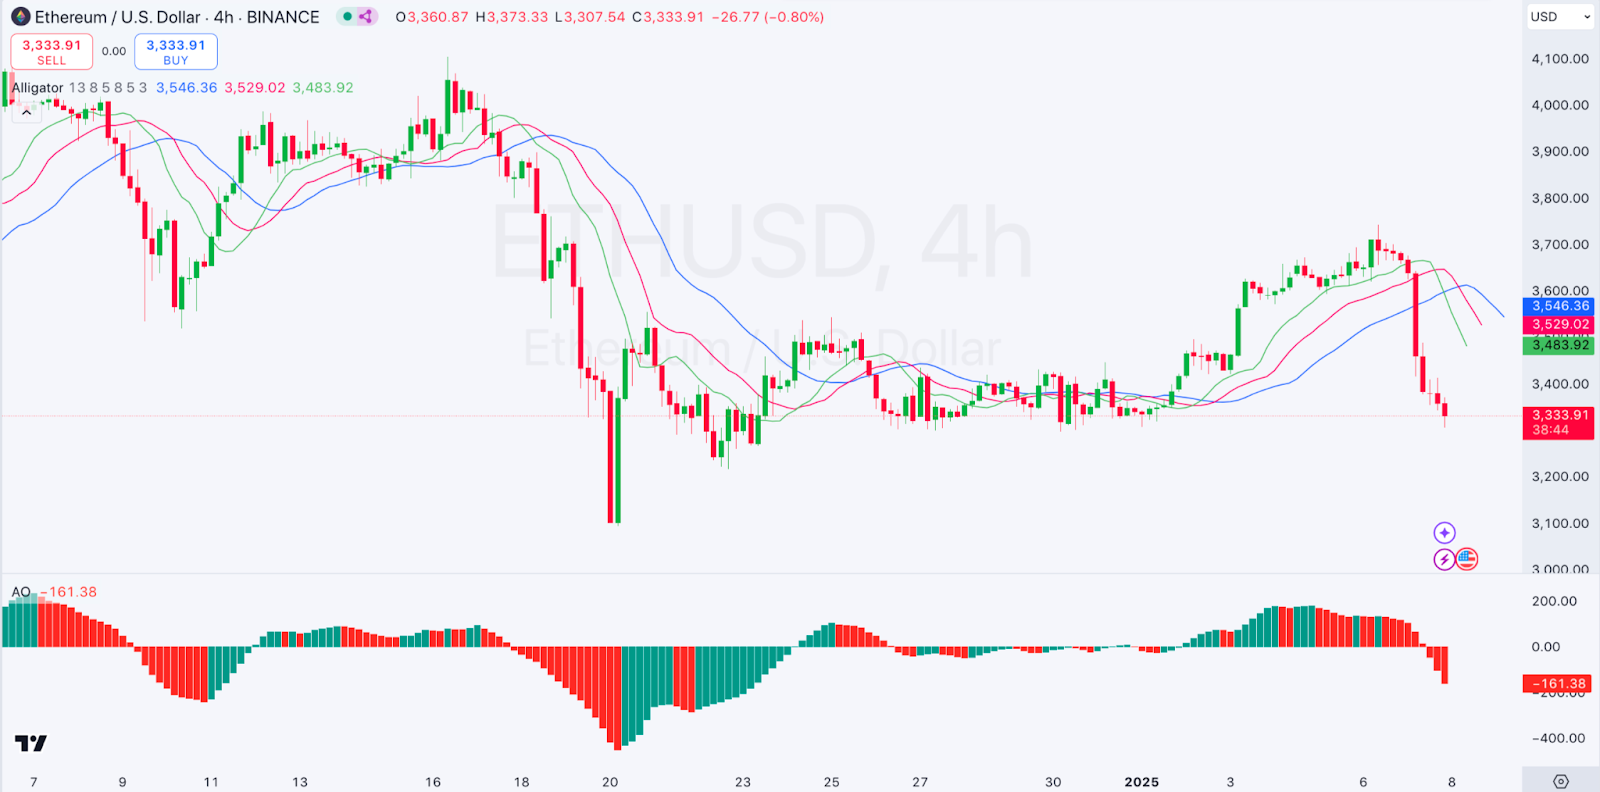
Ethereum, $ETH, is also showing a massive price drop in today’s session as also seen from its price movements. Looking at an in-depth analysis, we see that ETH is trading below the Alligator lines, with all lines converging downward. This suggests a continuation of the downtrend.
On the other hand, the AO shows a bearish momentum with red bars deepening. Immediate support lies near $3,307. Further bearish momentum could drive ETH lower. Ethereum traded at $3,338 as of press time, representing a 9.1% decrease over the last 24 hours.
Fantom Price Review
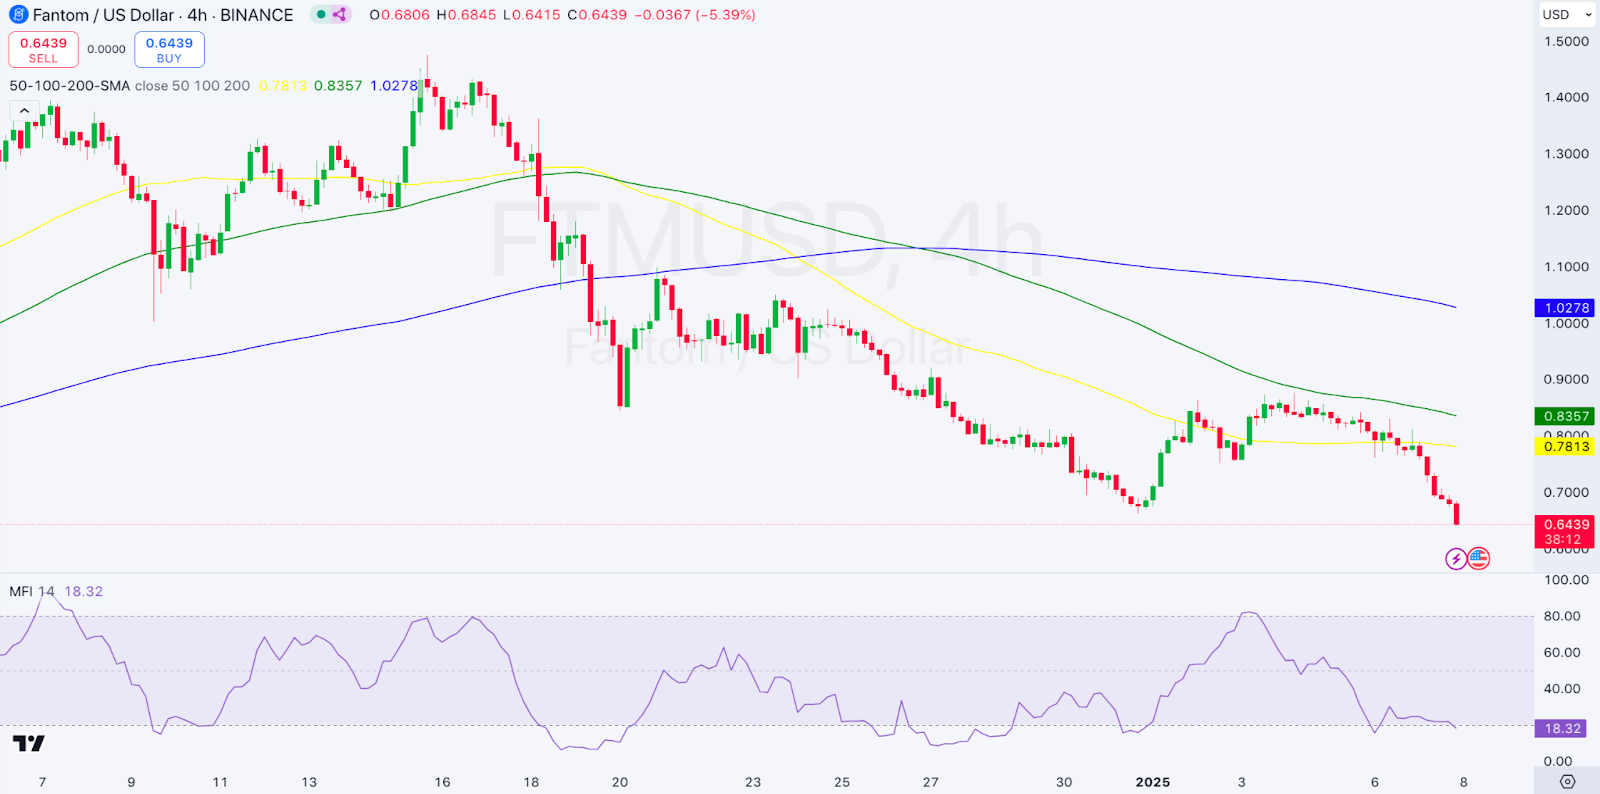
Fantom, $FTM, is among the top losers in today’s session as also seen from its price movements. Looking at an in-depth analysis, we see that FTM is trading significantly below its SMAs, confirming a bearish outlook.
On the other hand, looking at other indicators, we see that the MFI at 18.32 suggests oversold conditions, implying a potential relief bounce. Fantom traded at $0.6383 as of press time, representing a 19.48% decrease over the last 24 hours.
Celestia Price Review
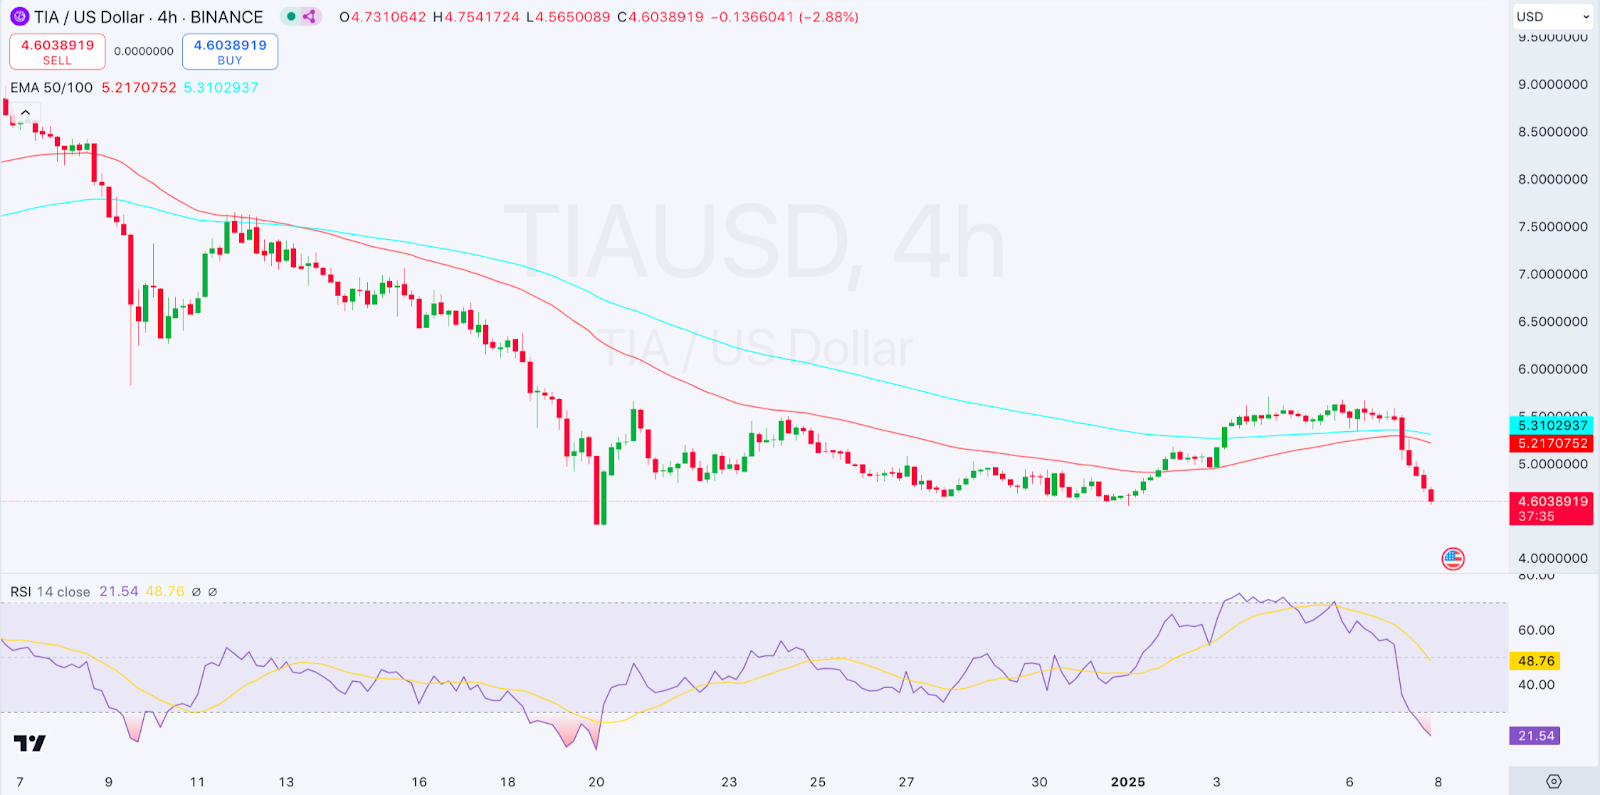
Celestia, $TIA, is also among the top losers in today’s session as also seen from its price movements. Looking at an in-depth analysis, we see that TIA is trading below the EMA 50 and EMA 100, highlighting a downtrend.
On the other hand, we see that the RSI at 21.54 indicates oversold territory, suggesting a potential near-term bounce. Celestia traded at $0.4.6 as of press time, representing a 15.87% decrease over the last 24 hours.
Ethena Price Review
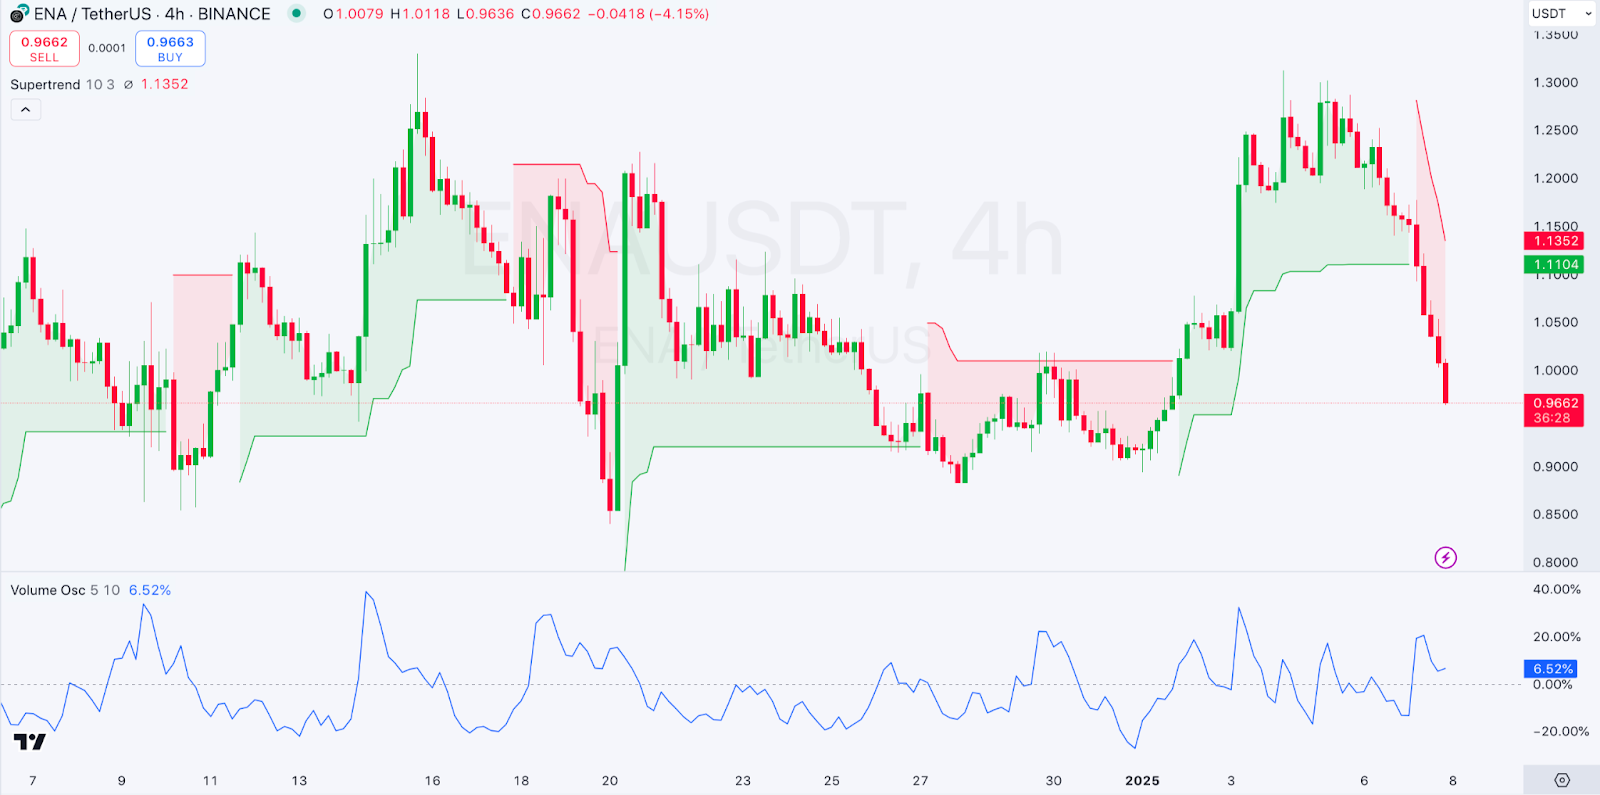
Ethena, $ENA, wraps up our list of losers as it also fails to post gains as seen from its price movements. Looking at an in-depth analysis, we see that ENA has broken below the Supertrend support, turning the indicator bearish. The Volume Oscillator at 6.52% indicates moderate trading activity, but with increasing sell volume.
On the other hand, we see that resistance is at $1.13, while immediate support lies at $0.96. A break below could lead to further downside. Ethena traded at $0.9644 as of press time, representing a 16.64% decrease over the last 24 hours.
