Chainlink ($LINK) price is consolidating after a significant breakout, with analysts predicting a major price surge fueled by strong accumulation within a defined range.
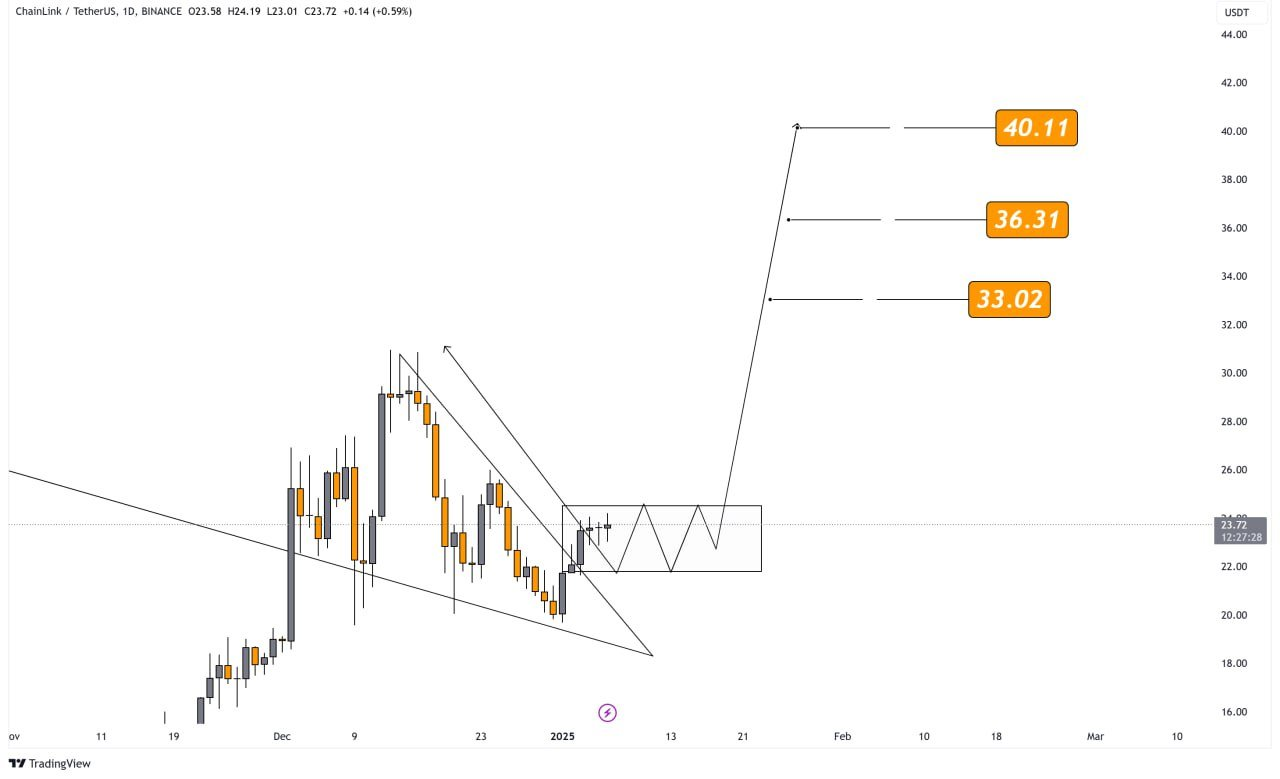
According to analyst VipRoseTr, $LINK is building momentum for a breakout and has identified key targets of $33.02, $36.31, and $40.11. As buyers steadily accumulate, the technical outlook suggests that Chainlink is primed for its next bullish move.
Post-Breakout Consolidation Indicates Accumulation
Chainlink has re-emerged from a descending wedge pattern and is currently in a consolidation phase ranging between $22.50 and $24.50. Such a sideways trend is typical for accumulation territory where buyers prepare for the breakout.

The price has been moving sideways within this square structure. This shows more support from the market participants, which means that there is likely to be upward price pressure.
VipRoseTr pointed out that this phase usually occurs right before a strong upward turn of the market. Since the market players are getting ready for the next stage of the trend. The next leg higher towards Chainlink’s higher targets is expected to be triggered by a breakout above the upper boundary at $24.50.
Chainlink Price Levels and Market Expectations
Market analyst VipRoseTr has shared three price levels that are important to watch. The first target is at $33.02, which is in line with historical resistance levels. It indicates the first step towards a bullish trend.
Furthermore, $36.31 is the second target, which is a very important level of resistance in line with Fibonacci extensions and prior price levels.
The last target of $40.11 is a psychological and technical level that shows Chainlink could regain its bullish momentum. Those targets would be quite a change in sentiment. It would further support the thesis that Chainlink is a solid performer.
Nevertheless, the price needs to break through the $24.50 level in order to start this up move, with a bump in volume required to back this up. The formation of the double bottom increases the chances of the bullish trend.
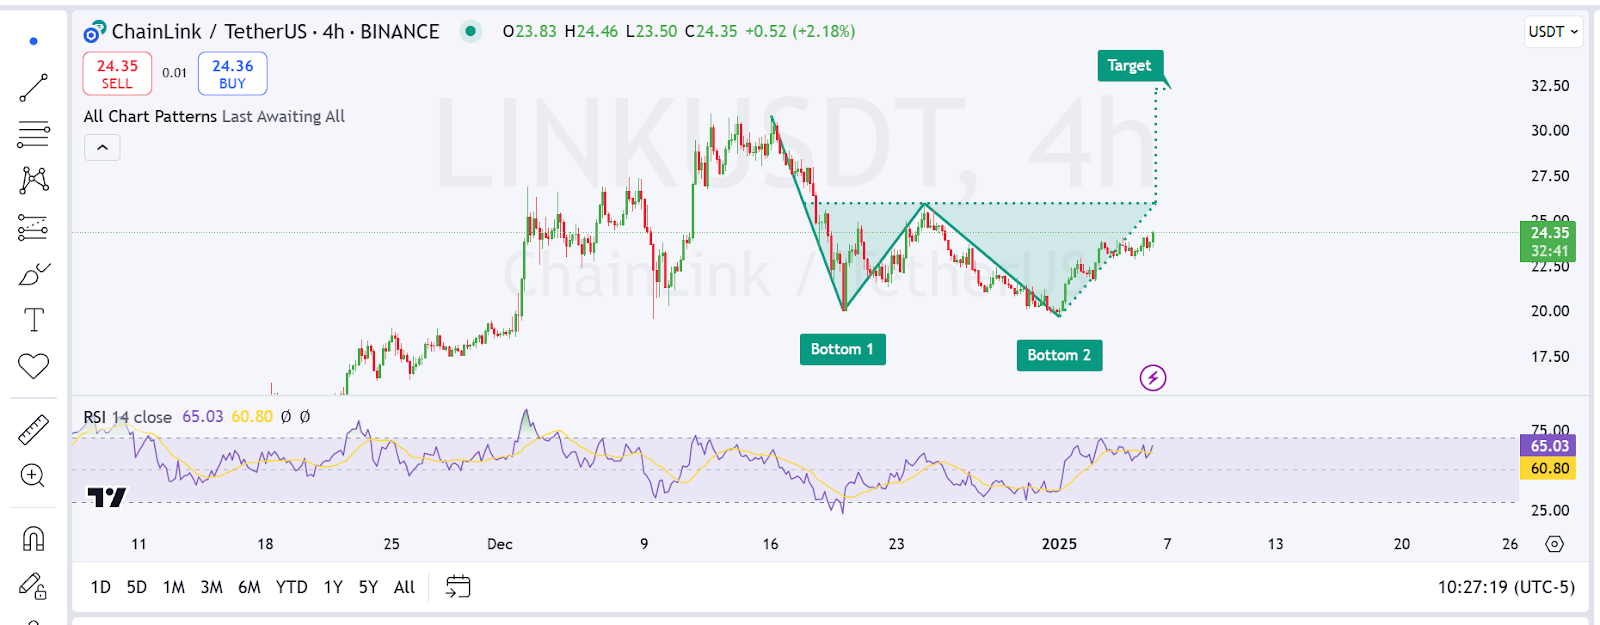
Apart from the consolidation zone, the 4-hour chart shows a double bottom pattern, a traditional indicator of a bullish reversal.

This pattern is defined by two clear cut lows in the $18 – $19 region and a neckline at around $25.00. If price breaks out above this neckline, the bullish thesis will be further supported. The door is open for a potential rise.
The double bottom pattern yields the first target at $32.50 and this is quite close to the first target resistance level suggested by VipRoseTr.
RSI is currently at 65.03 hence still has some more potential to go higher before reaching the overbought zone in the direction of the trend. If the RSI gets to around 70 then traders may get a brief correction or an opportunity to consolidate before the next move higher.
Levels of Support and Resistance to Keep an Eye On
Chainlink price is currently trading within a range between $22.50 and the recently broken resistance at $25.00. A breakdown below this level could lead to further retracement towards the $20.00 level, a major swing low support.
To the up side, we have the $24.50 which is a barrier that needs to be broken through to validate a breakout.
Chainlink’s next bullish target is $33.02, $36.31, and $40.11, as long as it stays above $24.50. These levels are therefore both psychological stages and technical limits which have in the past determined the price action.
Traders are now observing volume and momentum in order to determine whether these levels will be breached or not.
.
 thecoinrepublic.com
