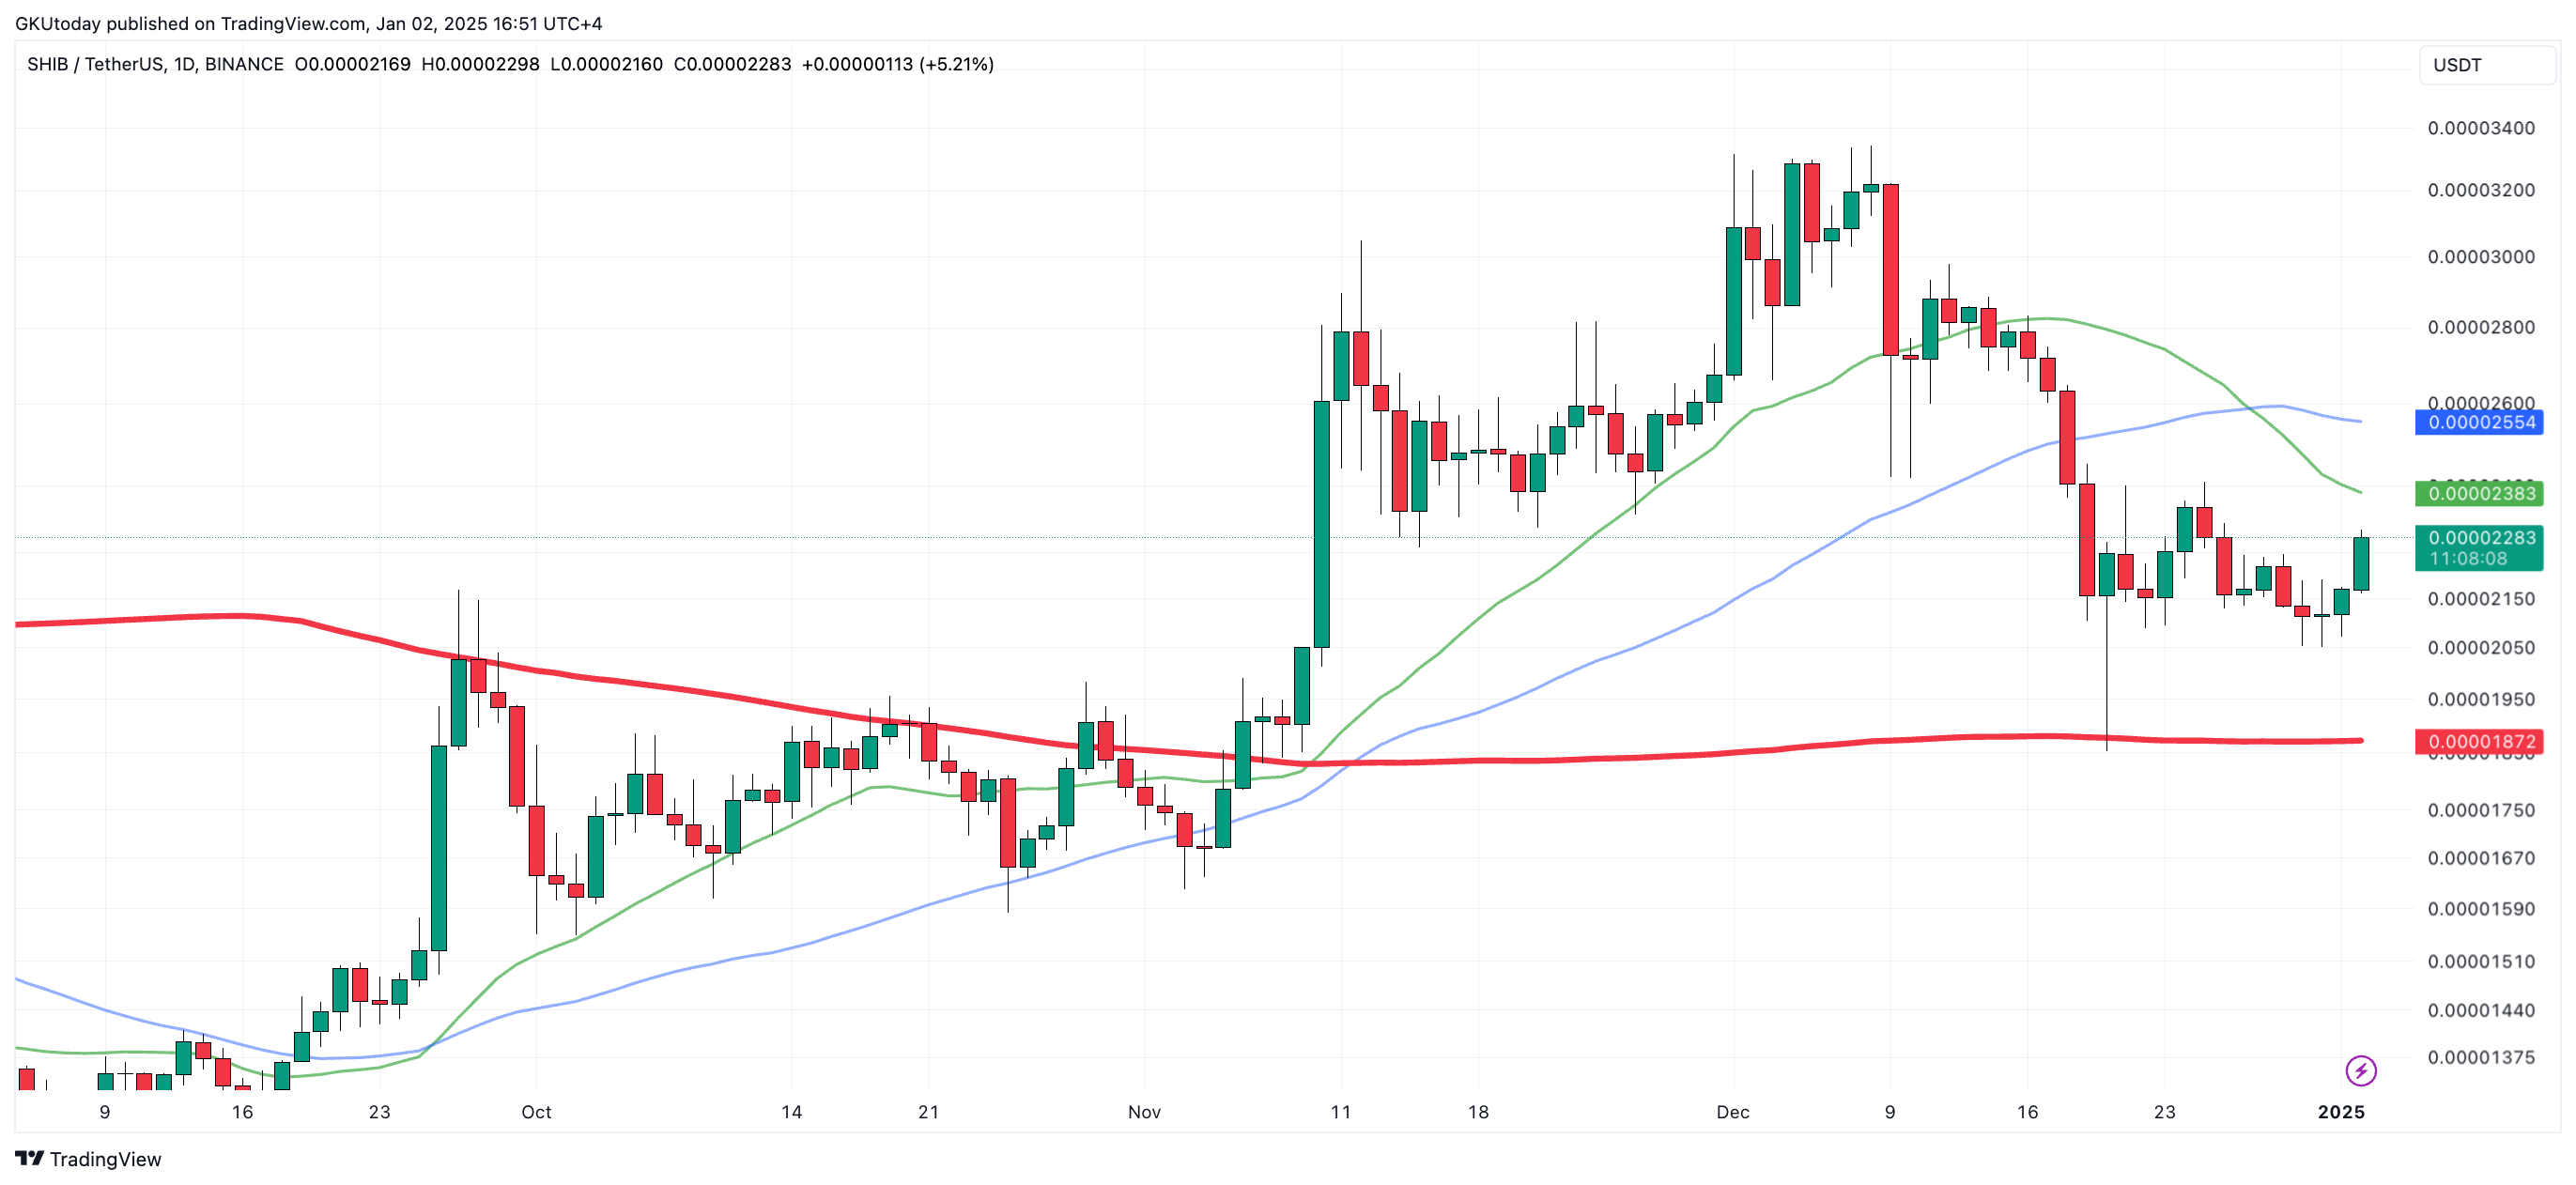
A few days ago, the price chart of the Shiba Inu (SHIB) token showed a "death cross," which is when a lower-order moving average dips below a higher-order one. This is usually a sign that downward trends are getting stronger. In this case, it was the 23-day moving average crossing below the 50-day moving average. A lot of traders took this as a sign that there would be a medium-term downtrend.
But markets aren't usually that simple. In less than a week, Shiba Inu found a local bottom above $0.00002, surprising everyone with a rally of over 5%. This quick rebound makes us look at growth paths instead of bearish probabilities, since the token is now close to key resistance levels.
The current position of the 23-day and 50-day moving averages creates a layered structure of potential obstacles. At $0.00002385 and $0.00002556, these points are like a critical zone where price activity could pick up. Right between these levels is the $0.000025 mark — a key resistance line that could be a focal point for further upward momentum.
If this threshold is overcome, it could signal strength sufficient to push the token toward new territory.

The $0.00003 level is a big deal, since it is a potential target that would mean a 30% gain from today's price. If Shiba Inu reaches this level, it will be in recovery mode, showing that it can ignore technical warning signs.
But the path upward is not guaranteed. The play between moving averages and resistance levels will likely decide if SHIB keeps its current momentum or retreats under new selling pressure.
Right now, Shiba Inu is in a pretty interesting spot, where it is sort of balancing between the bearish technical signals and these unexpected bursts of strength.
 u.today