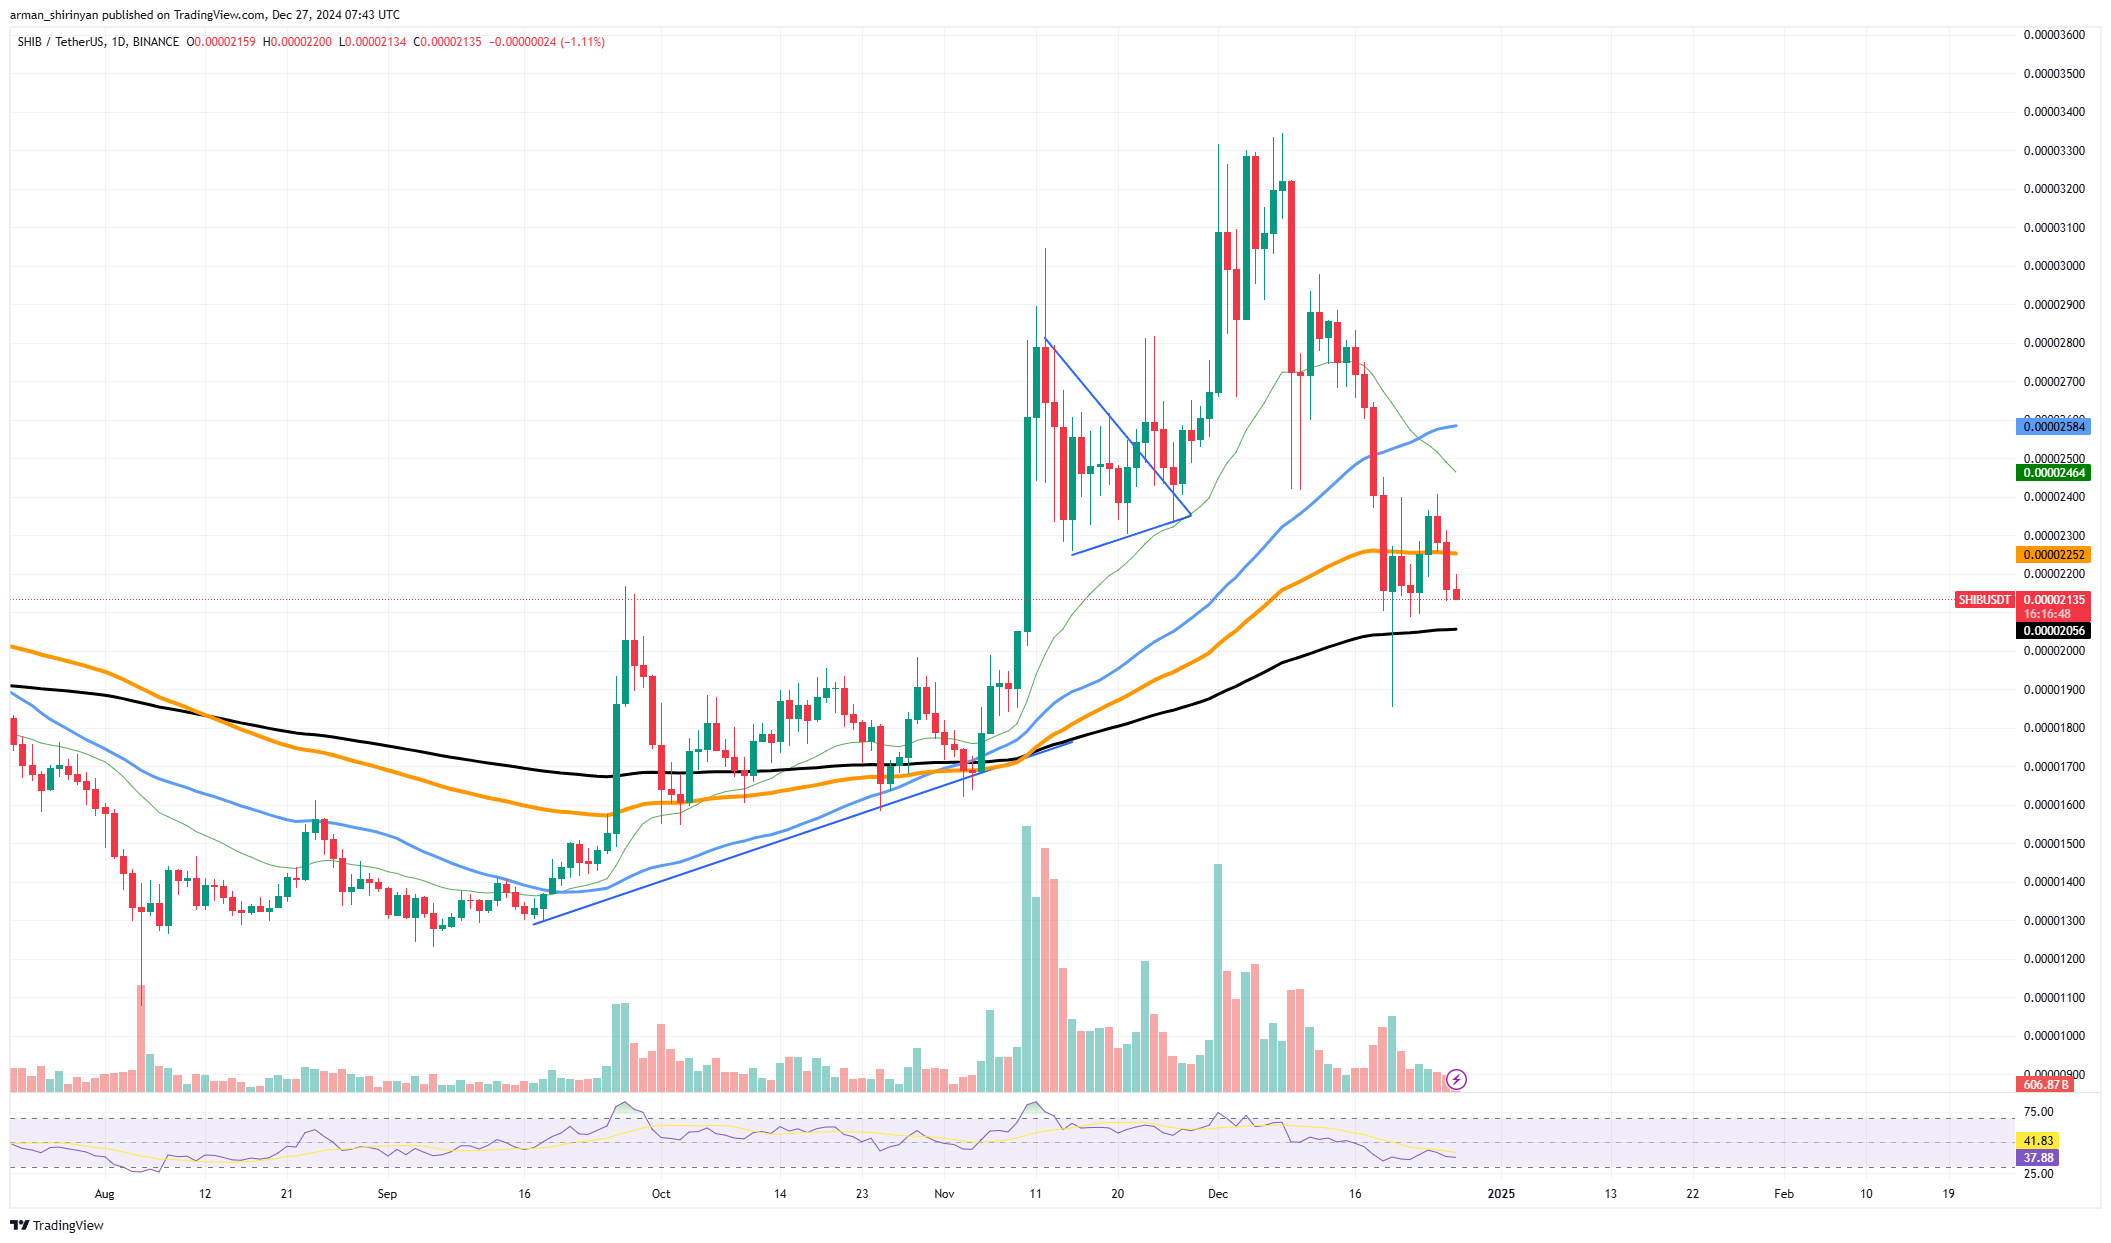
A developing double-bottom formation that can be seen on the daily chart suggests that Shiba Inu may be indicating a possible reversal. The long-awaited catalyst for SHIB investors may be this traditional bullish pattern, which is frequently linked to a shift in the market.
After a protracted decline, SHIB is currently trading at about $0.00002177, indicating that it is stabilizing. At $0.00002105, which has held steady over the last few sessions, the asset is testing critical support close to the 100 EMA. Even though SHIB seems to be holding its ground so far, a retest of the 200 EMA near $0.00002054 could occur if this level is not maintained.

If SHIB breaks important resistance levels, the double-bottom pattern indicates that it may be able to reverse its negative momentum. The 50 EMA, or $0.00002350, is the first obstacle. A more important resistance zone is located at $0.00002585. A 50% upward move could be possible if these levels are cleared, which could return SHIB to its most recent highs of about $0.00003500. But volume is still a problem.
There is currently little buying pressure, which begs the question of whether bulls have enough momentum to overcome resistance levels. In order to validate the double-bottom formation and start a long-term recovery, there must be a significant increase in volume. As a preliminary indication of a reversal, SHIB investors should wait for a clear move above $0.00002350.
A decline below $0.00002105 might render the bullish setup erroneous and indicate additional weakness. Finally, the double-bottom pattern of Shiba Inu suggests a possible trend reversal. Despite the potential for a 50% rally, traders should exercise caution and keep an eye on volume levels and important price zones to support the bullish viewpoint.
 u.today