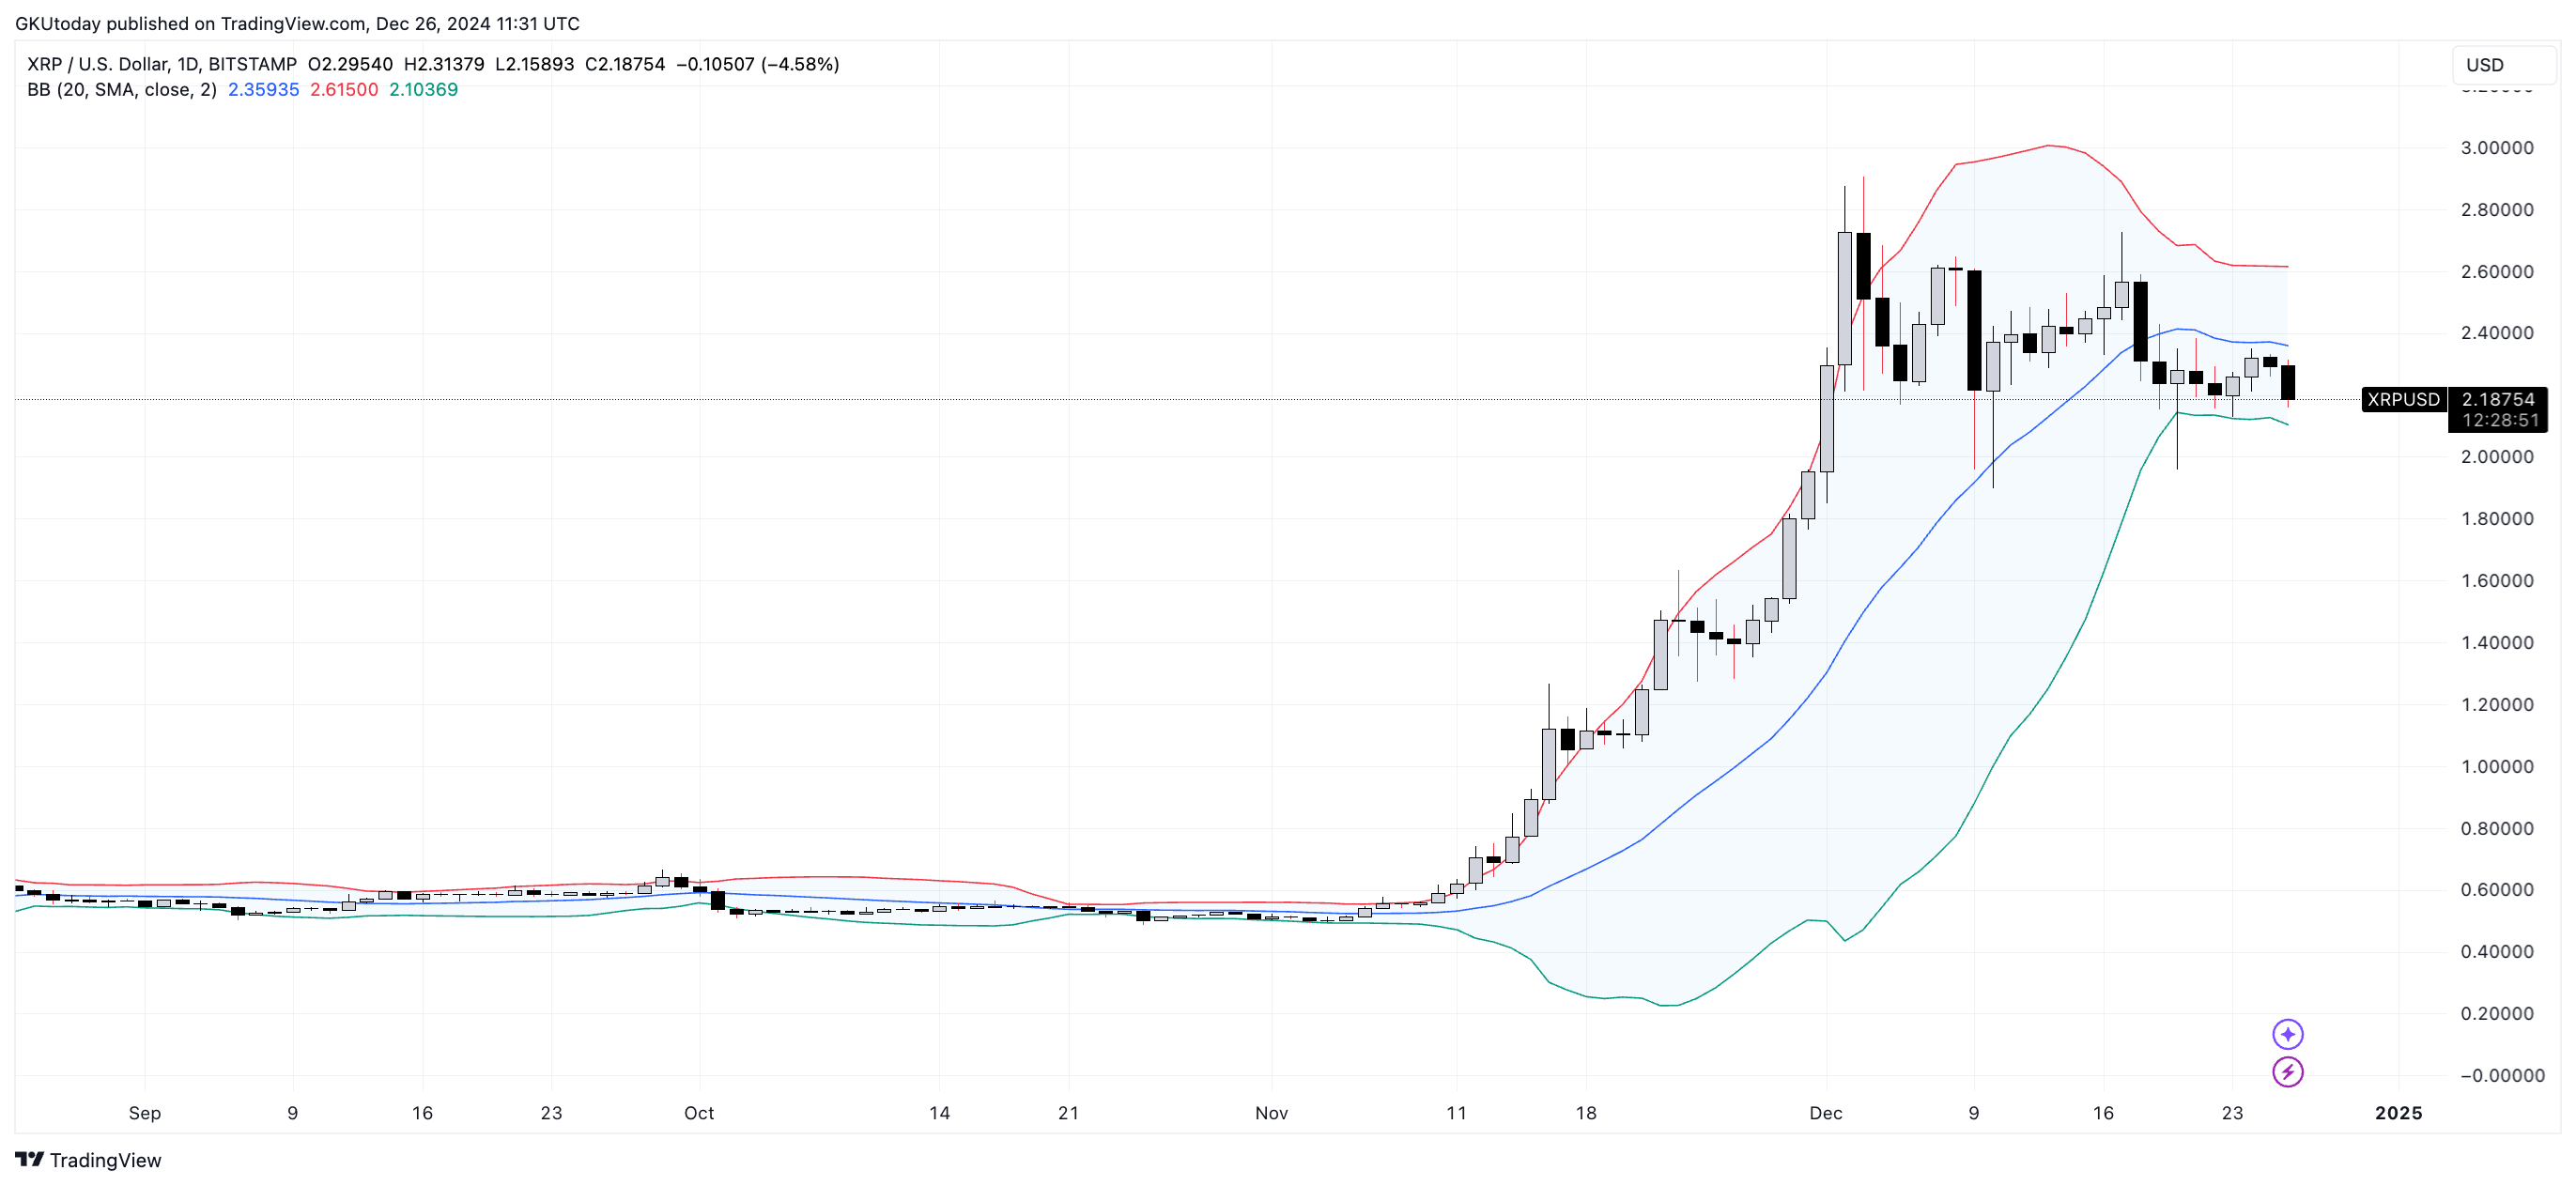
The price of the popular cryptocurrency XRP still has more downside than upside. At least that is what the Bollinger Bands tell us if we take a look at the price chart using this popular indicator.
Last week, U.Today reported that XRP was on the verge of a painful drop to as low as $1 per token. The essence of that prediction was the popular cryptocurrency's 2018-like price action, where the price breaks out of the upper band and then returns to the median. Since that article, the price of XRP has fallen by more than 3.5% and still has room to fall.
However, it may not be as painful in the short term as it first appears. The Bollinger Bands on the daily price chart for XRP currently show the lower border of a range at $2.103, which is another 3.56% down from the current price.

If XRP manages to find a local bottom there, further declines are unlikely in the short term. Meanwhile, on the weekly price chart, the lower band may see a spike and, in that case, the grim projection of $1 per XRP may remain only a nightmare and not a reality.
Nothing is set in stone, and the guesses on cryptocurrency price charts change as quickly as new information comes in. Where XRP will find its stopping point and return remains an open question. It is still over $2 per token and only 53% to a new all-time high.
XRP is still the third largest cryptocurrency on the market, with a capitalization of $125 million and daily volume of $4.67 billion — something that seemed unreal two months ago. This is how quickly things can change radically for the asset.
 u.today