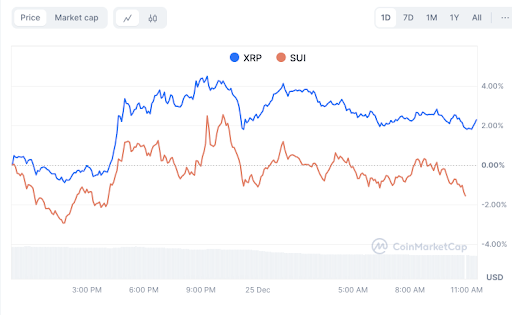
The cryptocurrency market is full-on speculation as to which altcoin will outperform in 2025. XRP and SUI, the two topmost contenders, grab investor attention due to their unique price movements and market behaviors.
While XRP demonstrates a steady upward trajectory, SUI showcases heightened volatility, making the race for dominance an intriguing battle. Both tokens exhibit distinct patterns, and analyzing their trends and technical indicators provides insights into their future potential.

XRP Consolidation and Bullish Potential
XRP’s current price stands at $2.29, reflecting a 2.23% increase over the past 24 hours. Recent price activity shows XRP consolidating at $2.28 after a notable rally in late November. The consistent upward trend, peaking around 4%, underscores market confidence.
Read also: Analysts Favor XRP, ADA, SOL for 2025 as Meme Coins Rebound
Key indicators suggest cautious optimism. The Relative Strength Index (RSI) at 52.42 indicates neutral momentum but hints at mild bullishness with its recent midline crossover. Similarly, the Moving Average Convergence Divergence (MACD) line marginally surpasses the signal line, showing weak but positive momentum.
Support for XRP is well-established at $2.15 and $2.00, levels where the price previously rebounded. Resistance is strong at $2.50, marking the upper boundary of its current range. A successful breach above this level could send XRP toward $2.70, a critical high. A dip below $2.15 may test its resilience at $2.00.
SUI Volatility and Consolidation
SUI is trading at $4.55, with a 1.68% decline over the past 24 hours. Unlike XRP, SUI demonstrates more volatility, peaking sharply before stabilizing below 0%. Current price action suggests consolidation near $4.53, signaling market indecisiveness.
Indicators present a mixed outlook. The RSI at 52.77 suggests a slight bullish bias. The MACD indicates weak upward momentum. The MACD histogram shows diminishing strength, possibly suggesting range-bound behavior.
Key support levels for SUI include $4.40, $4.20, and the psychological benchmark of $4.00. Resistance lies at $4.65 and $4.80, with $5.00 presenting a significant psychological barrier. A breakout above $4.65 could signal bullish momentum, while a decline below $4.40 might trigger further dips.
Disclaimer: The information presented in this article is for informational and educational purposes only. The article does not constitute financial advice or advice of any kind. Coin Edition is not responsible for any losses incurred as a result of the utilization of content, products, or services mentioned. Readers are advised to exercise caution before taking any action related to the company.
 coinedition.com