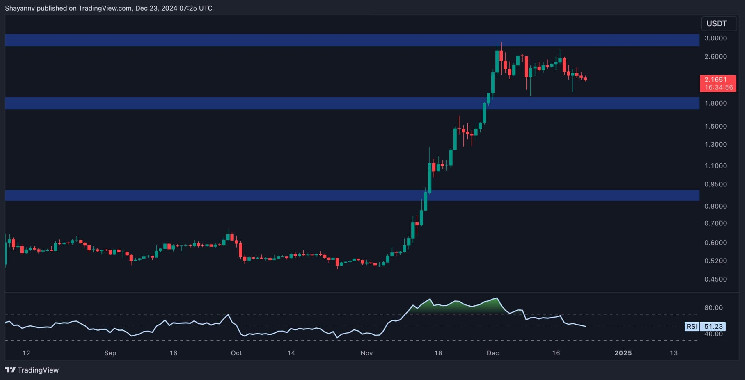
Ripple is navigating a pivotal range between $1.8 and $3, with recent price action highlighting the likelihood of a consolidation phase.
A breakout from this range will likely determine its next significant trend.
XRP Price Analysis
By Shayan
The Daily Chart
XRP recently faced rejection at the critical $3 resistance, triggering increased volatility and initiating a sideways consolidation phase. After that, the price found support at the $1.8 level, a key zone filled with demand and buying pressure.
This support region can limit further downward movement and maintain the cryptocurrency within the $1.8-$3 range.
As the price consolidates, a bullish or bearish breakout will determine Ripple’s upcoming trajectory. While this could lead to a sustained uptrend, an unexpected bearish breakdown might trigger a significant liquidation event, causing the price to plummet toward lower levels.

The 4-Hour Chart
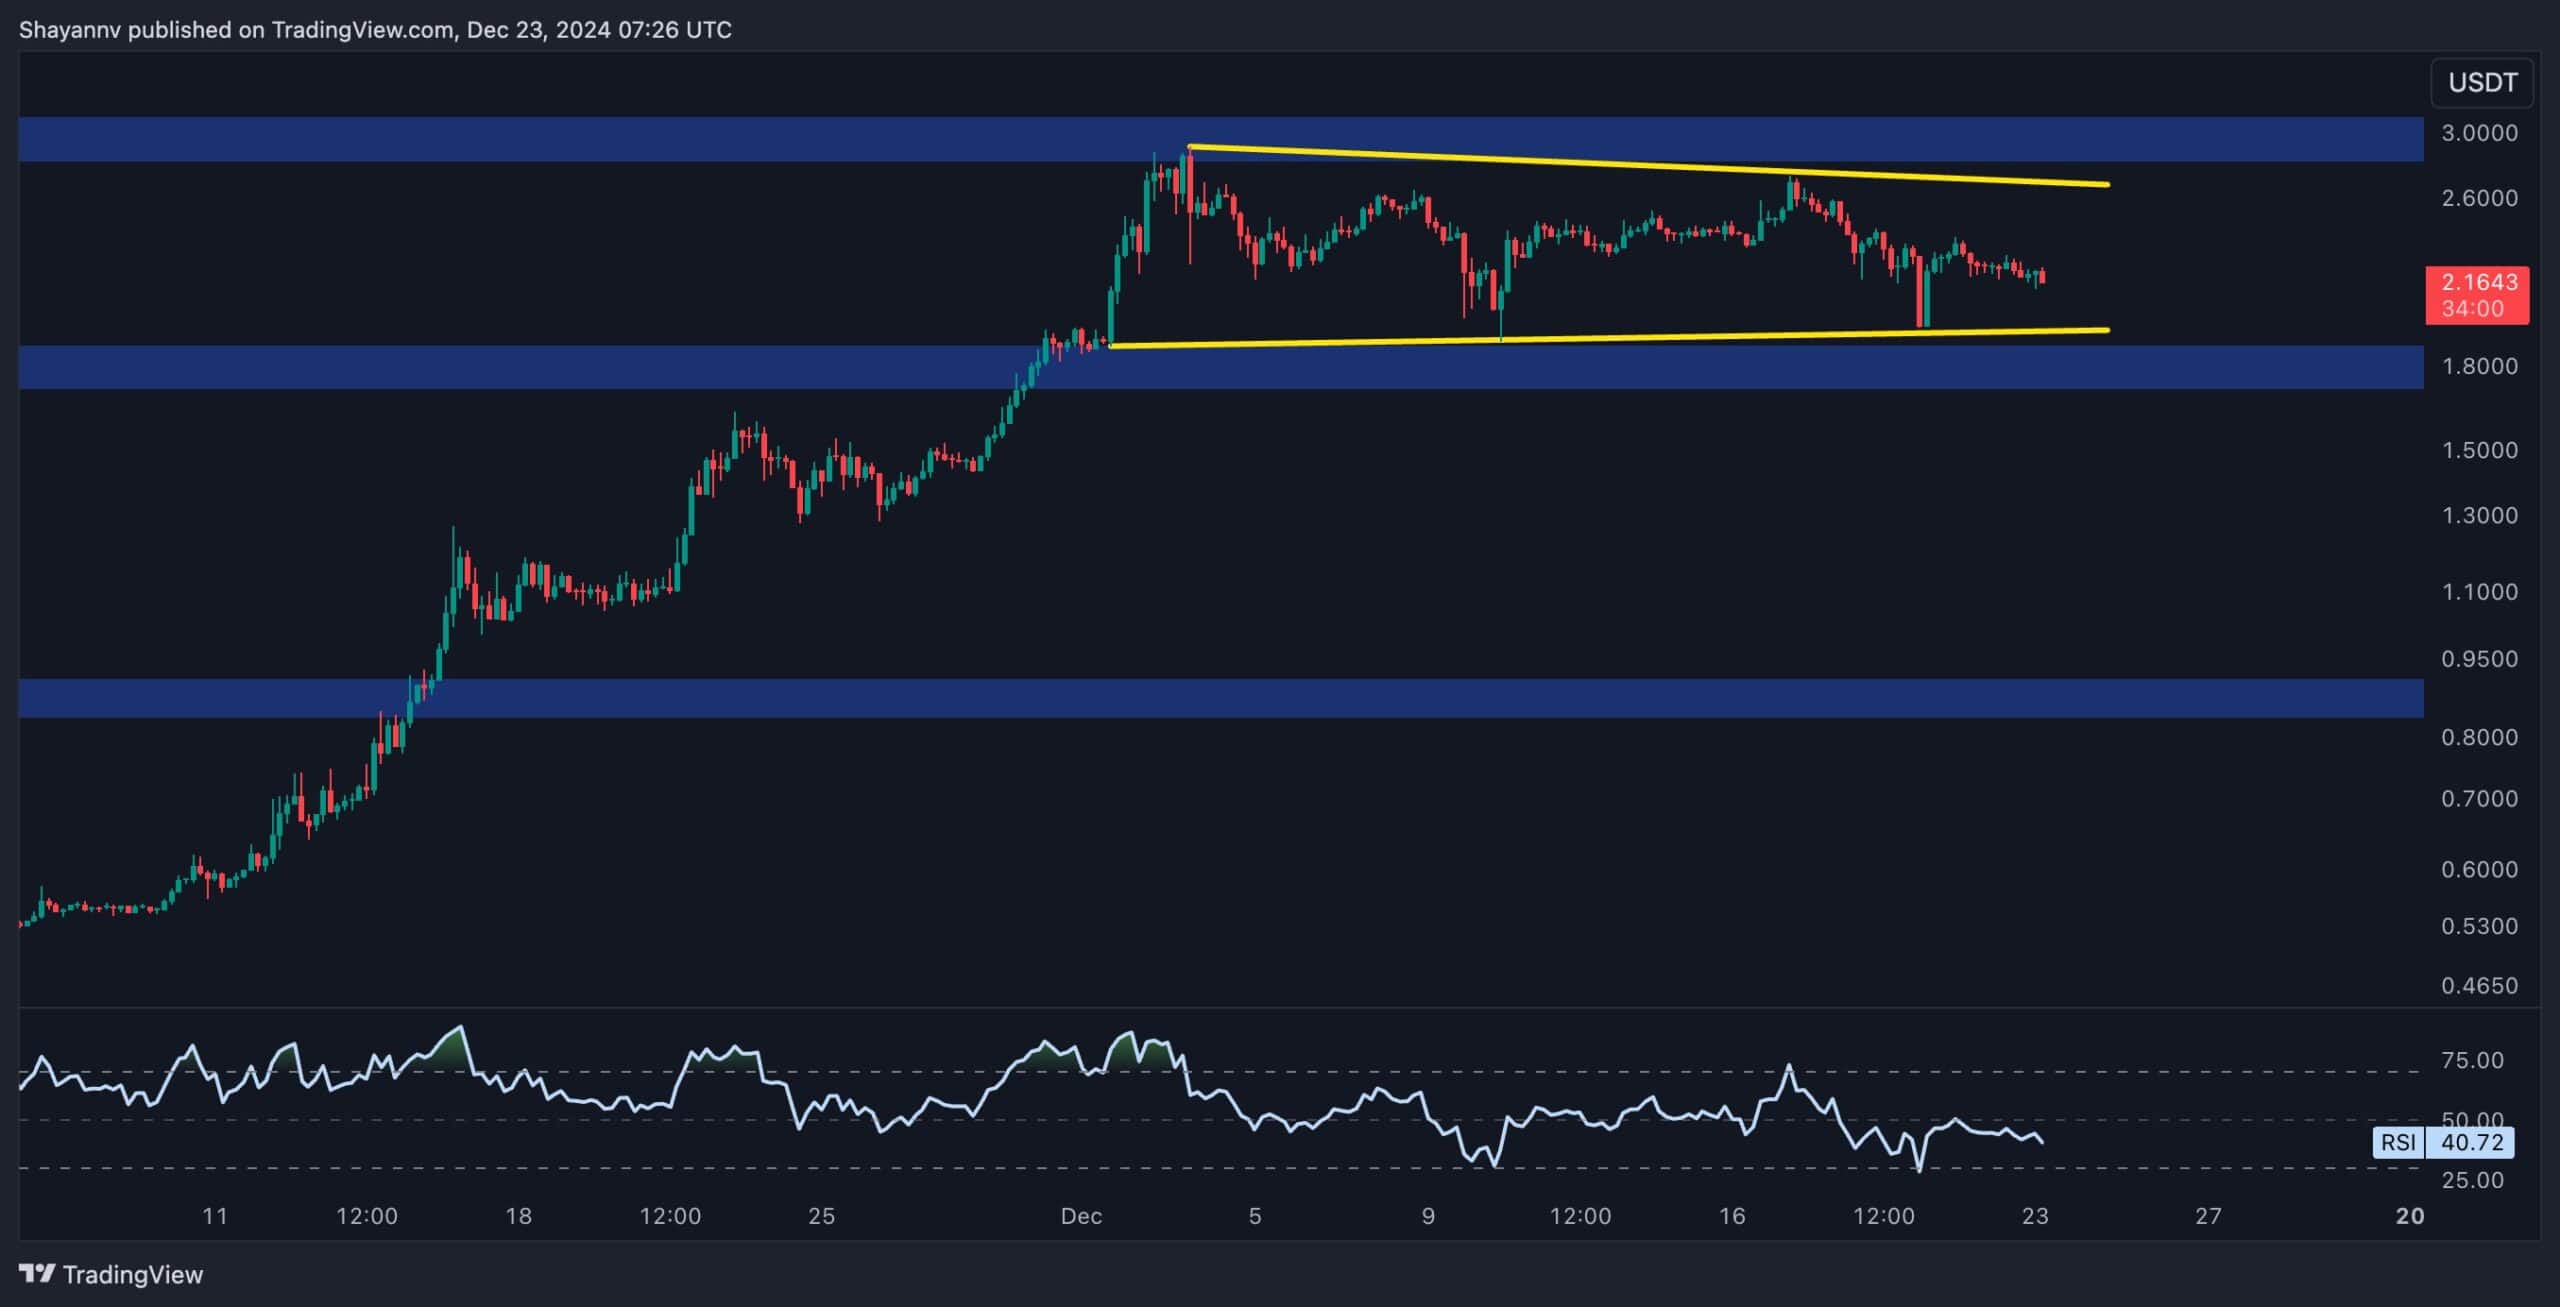
During the 4-hour timeframe, XRP consolidates within a descending wedge pattern, which often signals a potential bullish breakout if breached upward.
Currently, the price is testing the wedge’s lower boundary near the $1.8 support level, where increased buying activity is expected.
In the mid-term, Ripple seems likely to continue fluctuating within this pattern, with a bullish breakout aiming to reclaim higher levels near $3. Conversely, a bearish breakdown below the wedge’s lower boundary could initiate a decline, potentially driving the price toward the $1.5 threshold, a crucial support level.

 cryptopotato.com