Dogecoin (DOGE) price has experienced a sharp reversal after recently surpassing Porsche’s market cap earlier this December. Following a strong rally, DOGE is now retracing, correcting 20% in the last 24 hours and nearly 30% over the past seven days.
This rapid decline shows the intensifying bearish pressure, with technical indicators signaling further downside risks. As DOGE’s price hovers near critical support levels, traders are closely watching for signs of stabilization or potential recovery amidst the heightened volatility.
Ichimoku Cloud Shows a Bearish Setup for Dogecoin
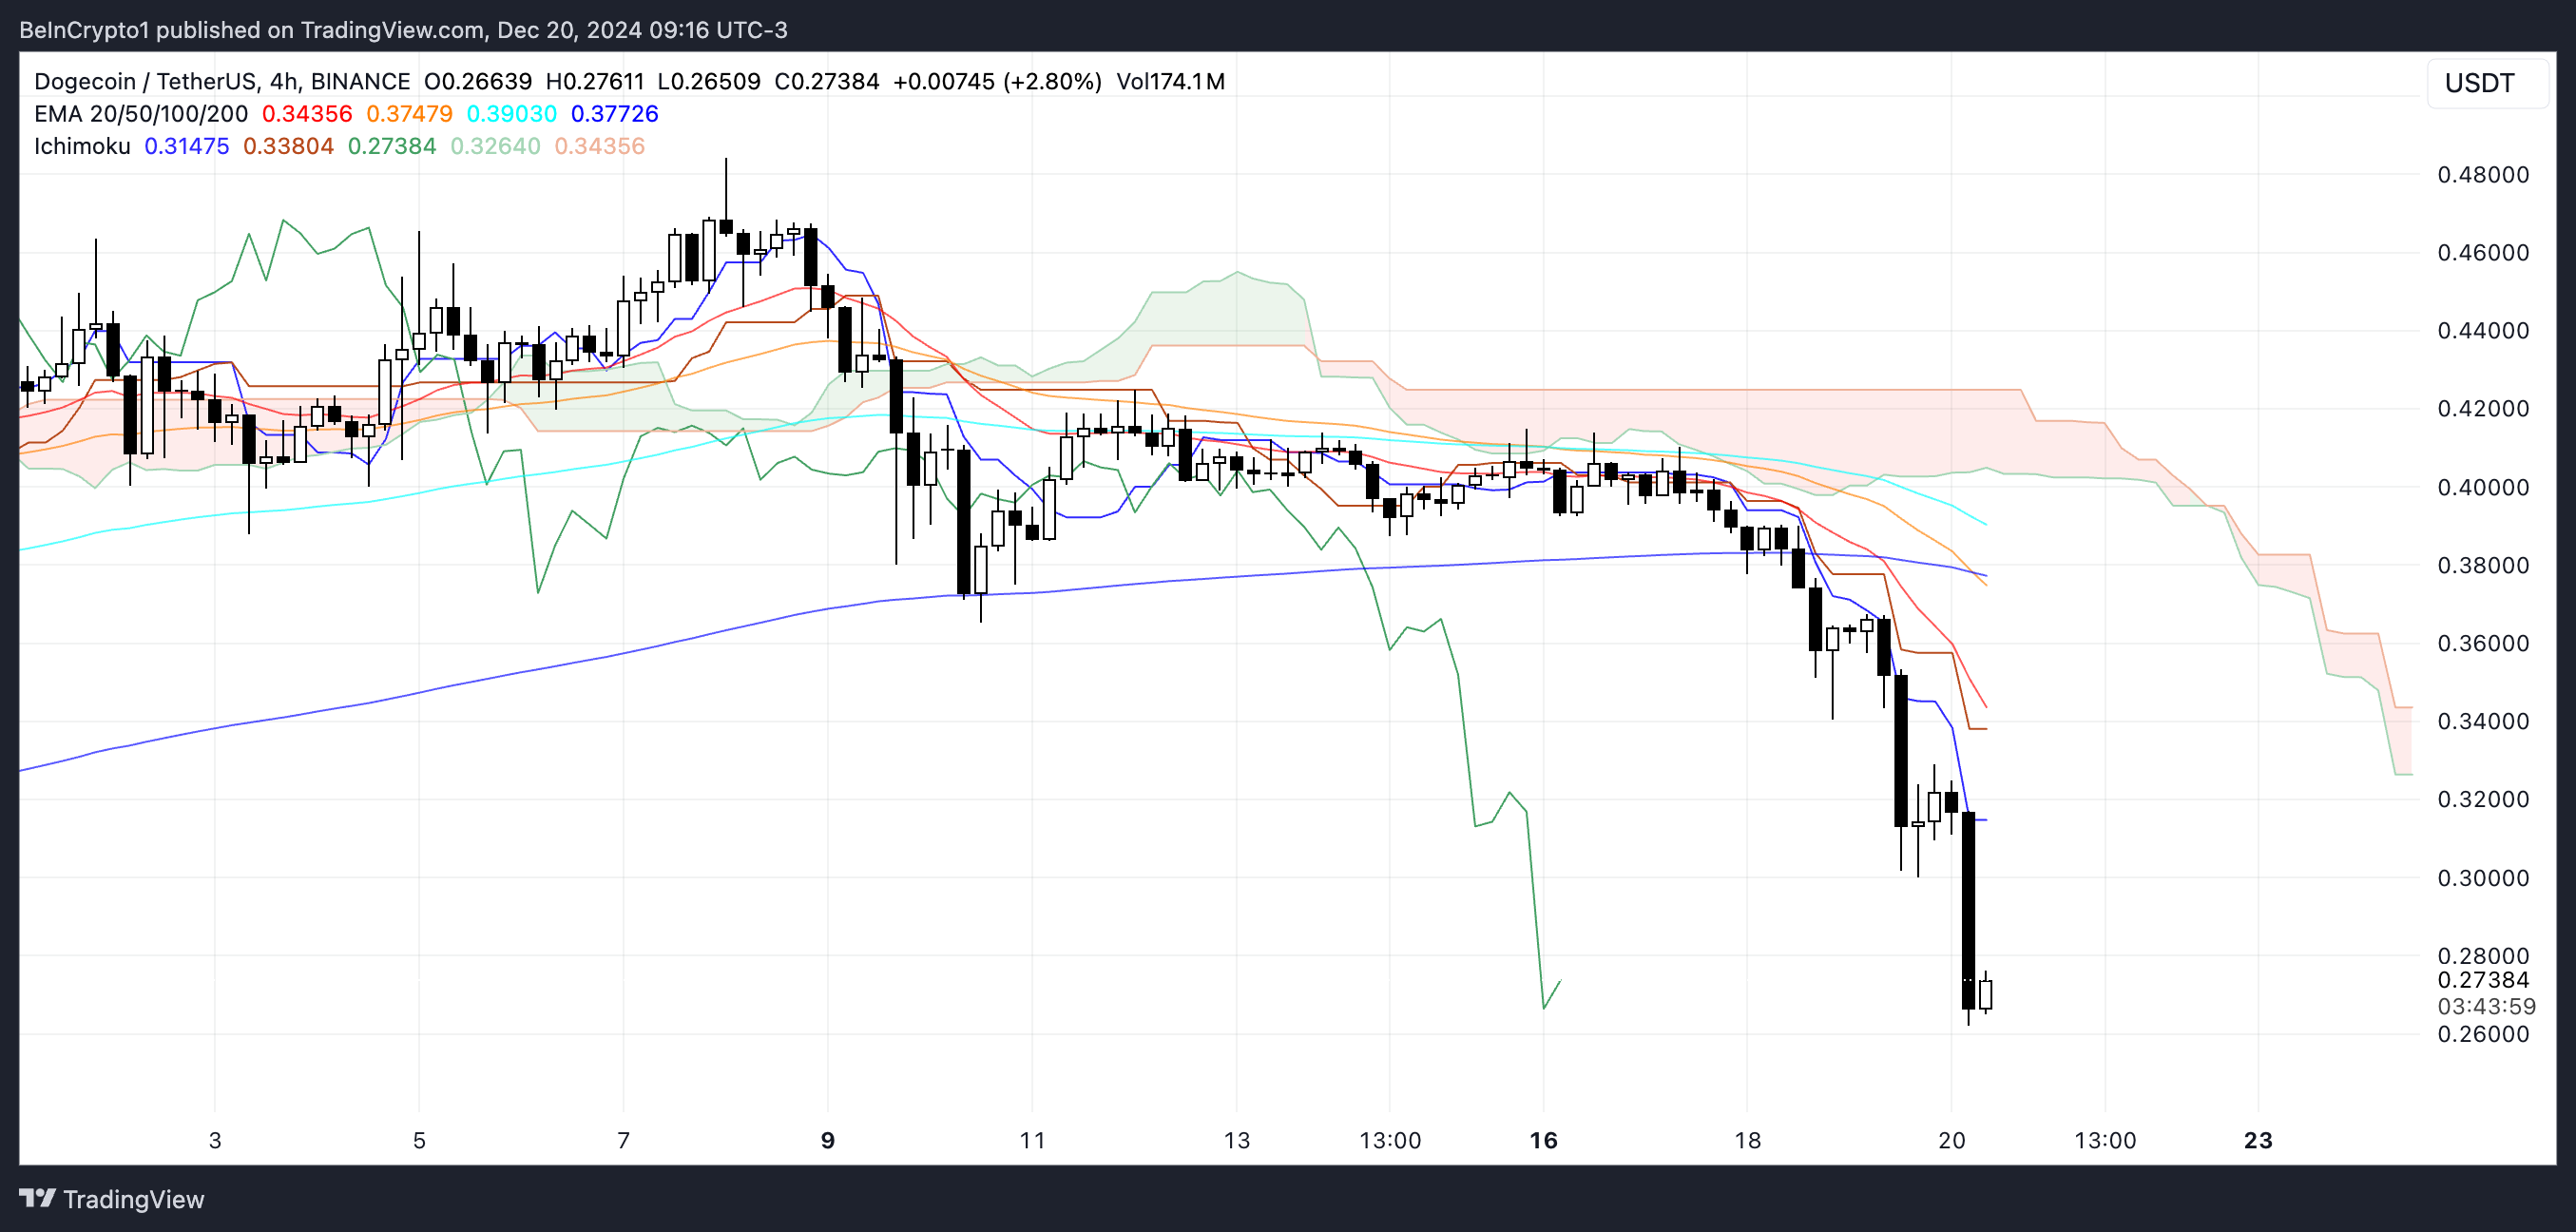
The Ichimoku Cloud chart for Dogecoin highlights a clearly bearish trend. The price is trading well below the Ichimoku Cloud, with the cloud’s red line (Senkou Span A) and green line (Senkou Span B) forming a thick, downward-sloping structure. This configuration suggests strong overhead resistance and reinforces the dominance of bearish momentum.
Additionally, the blue Tenkan-sen line remains below the red Kijun-sen line, a bearish crossover that reflects continued short-term and medium-term weakness. The green lagging span (Chikou Span) is positioned below both the cloud and the price action, further confirming the bearish sentiment.

The descending nature of the red (Senkou Span A) and green (Senkou Span B) cloud lines ahead indicates that the bearish trend is likely to persist unless there is a significant reversal.
If the downward momentum continues, DOGE price could face further declines, with support levels likely near recent lows. A reversal would require the price to break above the cloud and see the blue Tenkan-sen line cross above the red Kijun-sen line, neither of which appears imminent at this point.
DOGE Current Downtrend Is Strong
The DOGE DMI (Directional Movement Index) chart shows significant bearish strength in the current trend. The ADX (Average Directional Index) value has risen sharply from 14.7 to 46.7 over the past three days, indicating that the strength of the trend—regardless of direction—has intensified substantially.
The orange D- line, representing negative directional movement, is currently at 45.7, significantly higher than the blue D+ line, which is at 5. This imbalance suggests that the downward trend is dominating, with sellers overwhelmingly in control of the market.

The ADX measures the strength of a trend, with key thresholds providing insights: an ADX below 20 suggests a weak or directionless trend, values between 20 and 40 indicate a moderate trend, and values above 40 reflect a strong trend. At 46.7, the ADX highlights that DOGE ongoing downtrend is gaining momentum.
In the short term, this combination of a high ADX, a dominant D- line, and a subdued D+ line suggests further bearish price action is likely, as the market lacks significant buying pressure to counteract the selling dominance.
Dogecoin Price Prediction: A Further Correction Ahead
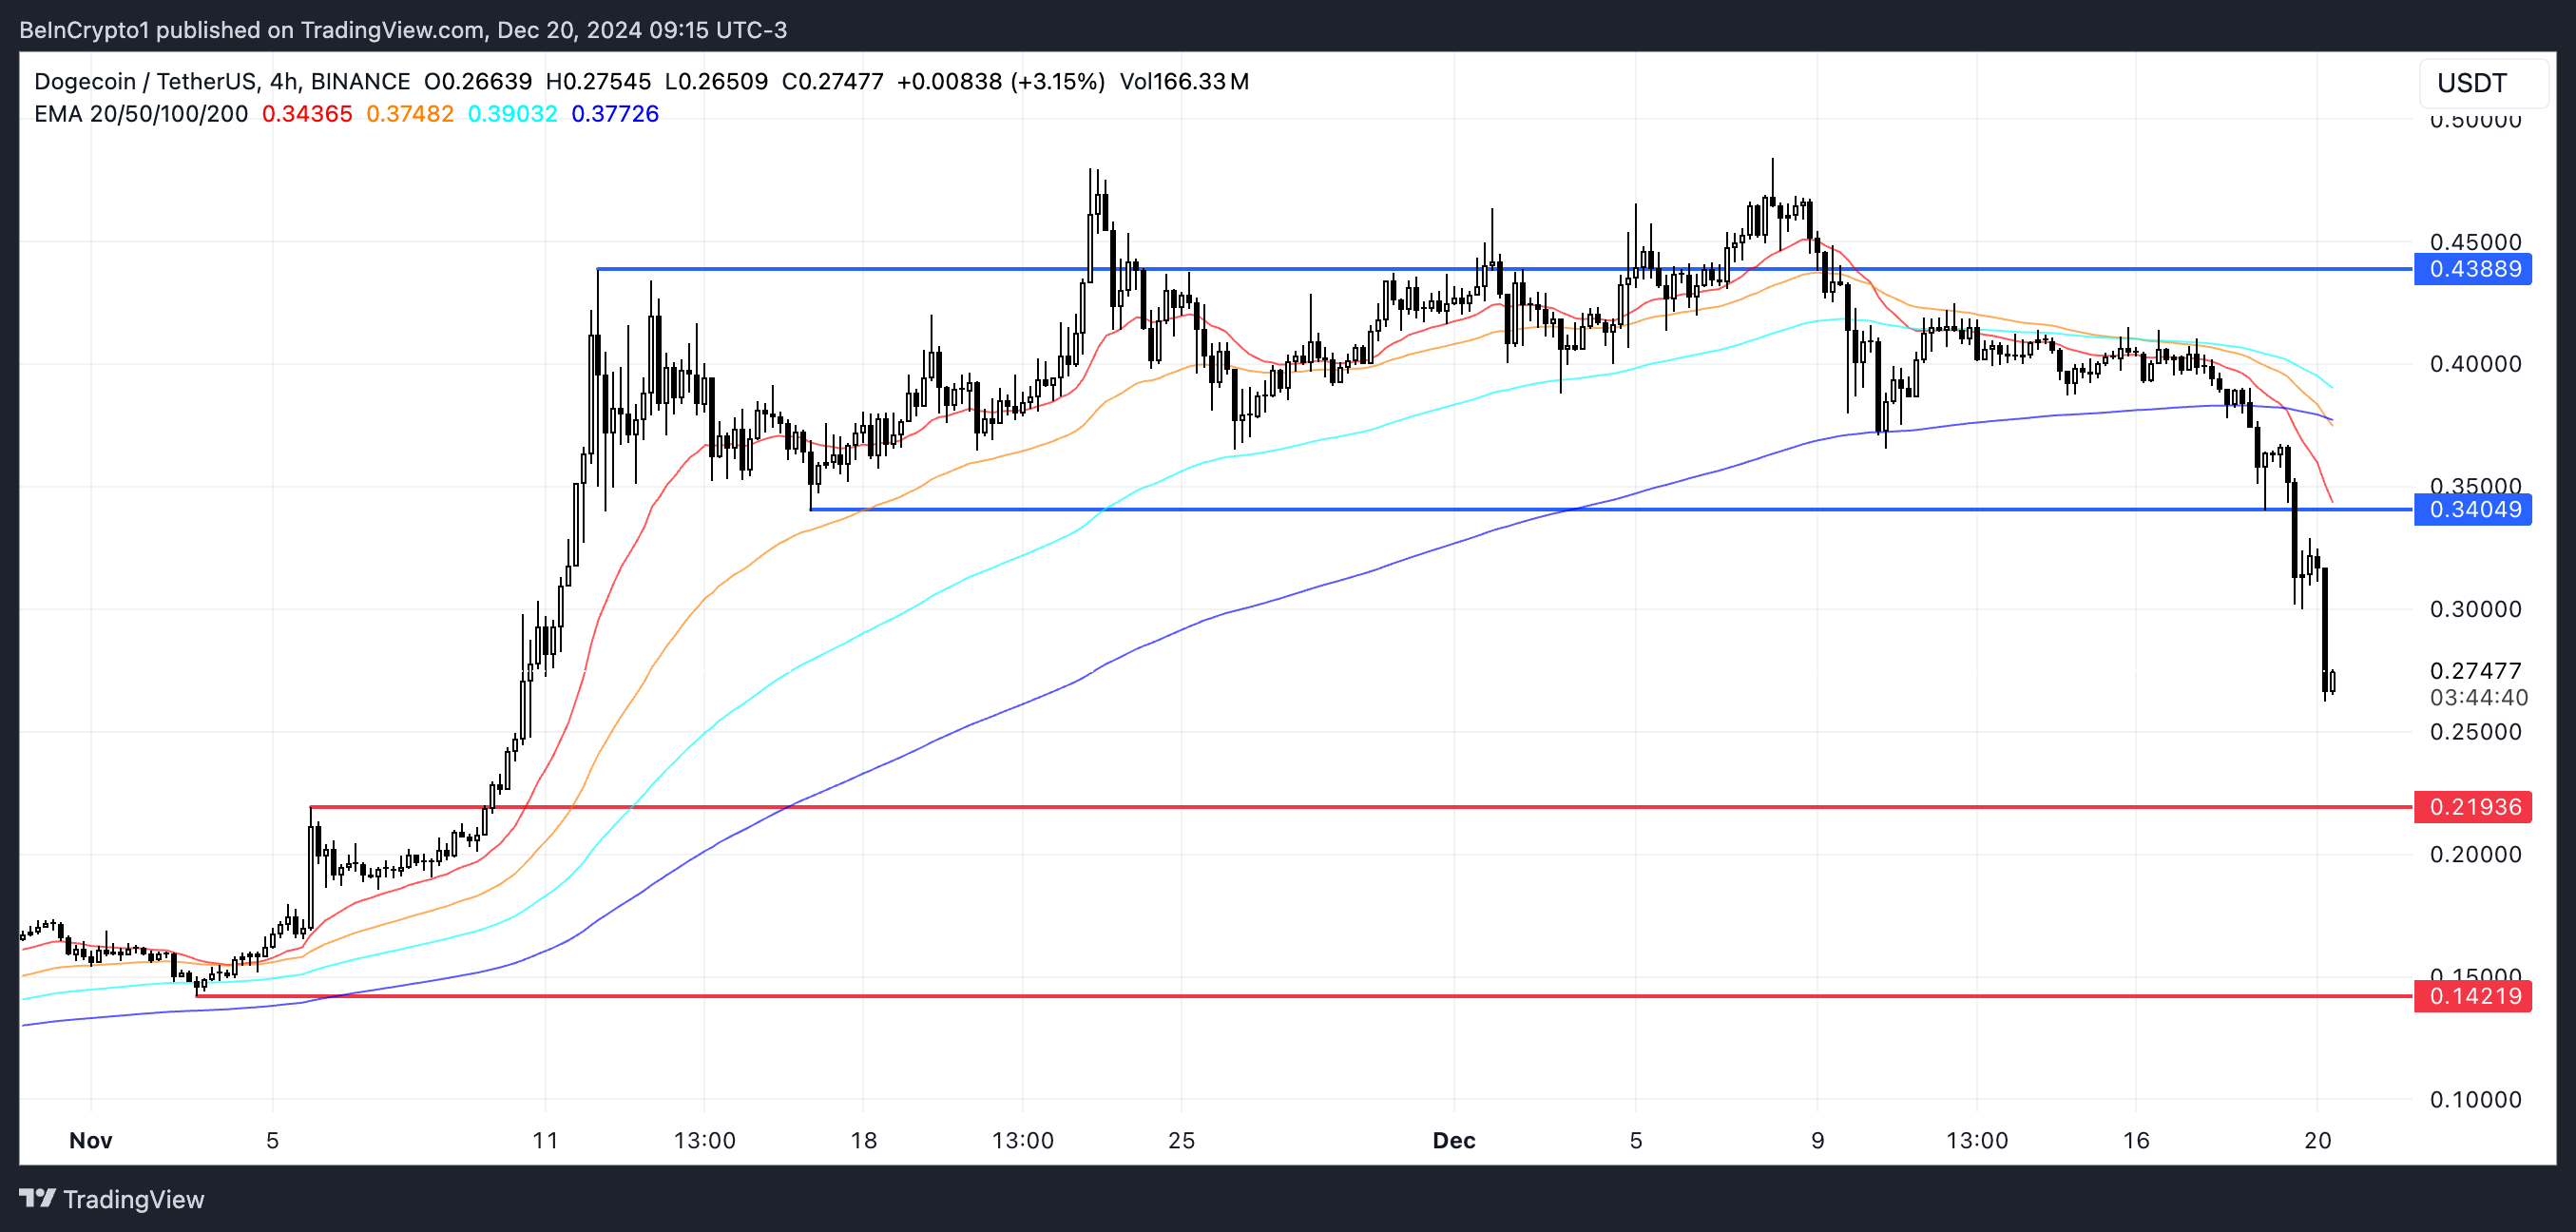
If the current downtrend persists, DOGE price could continue its descent toward the next critical support level at $0.219. This level is a key area where buyers may attempt to stabilize the price; however, if selling pressure persists and this support is broken, the price could fall as low as $0.14.
Such a move would represent a further 48% correction from the current levels, showing the severity of the bearish momentum. Given the dominance of sellers and the strong downtrend highlighted by recent technical indicators like the DMI, this scenario remains plausible unless significant buying interest emerges.

On the flip side, if DOGE price manages to regain positive momentum, the price could target a recovery to $0.34, the first notable resistance level. A successful break above this zone could pave the way for a further rise to $0.43, representing a potential 59% upside from the current price.
Achieving this recovery would likely require a shift in sentiment, with strong buying pressure and a reduction in bearish dominance.
 beincrypto.com